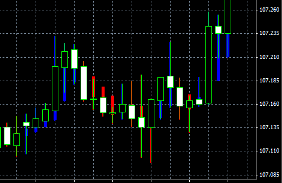
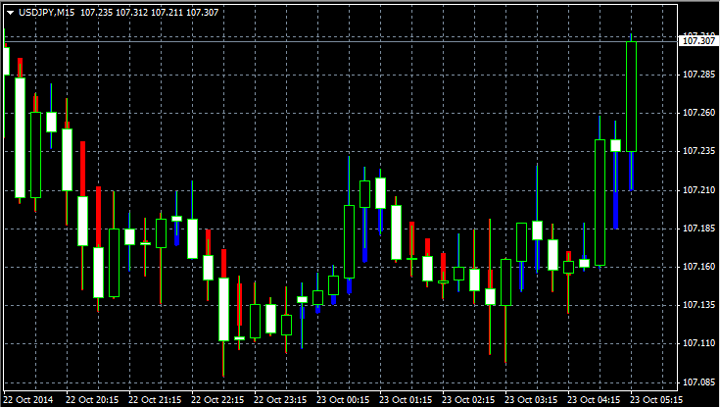
Heiken ashi indicator.
One of the most famous indicators, which is used when working with Japanese candlestick charts, is used when conducting a visual analysis of a trend; according to the authors, it creates a more realistic picture of the existing trend.
The main advantage of this tool over standard candles is that it works a little with a delay, analyzing the data received and displaying the result on the chart of the currency pair , but it is not leading, but it really evaluates the trend.
The Heiken Ashi indicator operates according to a fairly simple scheme using the average price of the previous candle, which allows you to filter out sharp price jumps and make the movement cleaner.
Its work is based on the following algorithm:
Opening price = (Opening price of the previous candle + Closing price of the previous candle) / 2
Closing price = (Opening price + High + Low + Closing) / 4
Minimum price = [Minimum value from (Min, Open , Closing)]
Maximum price = [Maximum value from (Max, Opening, Closing)]
This data is more of a reference nature since the indicator does not provide the ability to change it.

Due to some inhibition, the Heiken Ashi indicator is more used on fast trends with high speed of movement and volatility .
Download the Heiken Ashi indicator .
In my opinion, the usefulness of the tool is quite controversial, especially since it was written quite a long time ago and is not always displayed correctly on some monitors with high screen resolutions. But this is just my personal opinion, perhaps you will find a worthy use for it. There are also other indicators for Forex .
