Is Japanese Candlesticks the best book on candlestick market analysis?
New market research methods emerge in trading every day, but not all of them gain investor acceptance.
Many new methods fall out of favor after just a few years, without ever proving their effectiveness.
Meanwhile, Japanese candlesticks have been around for decades and are used not only in manual analysis but also as the basis for automated trading advisors.
The most important issue here is the practical application of candlestick patterns and the creation of working strategies based on them.
The best source of information for learning how to use Japanese candlesticks is a book. In this article, I will provide examples of books available for download from our website.
Japanese candlesticks.
The history of Japanese candlesticks dates back to the 17th century. It is believed that 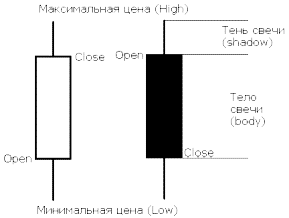 a Japanese rice trader was the first to use this tool in technical analysis, hence the name "Japanese candlestick."
A Japanese candlestick is a graphical pattern that displays exchange rate fluctuations over a specific time period.
The main parameters that can be determined by studying a Japanese candlestick are:
• Opening price - displays the quote at the beginning of the time frame, for example, on H1 from 16:00 to 17:00 the opening price will be the quote at 16:00.
• Closing price – a parameter similar to the previous one, but already displaying the quote at the end of the time frame.
Price Action - Identifying Reversals and Corrections
There's a popular saying among traders: "Price is the most valuable indicator." Displaying charts as Japanese candlesticks allows every trader to experience the benefits of this analytical approach.

For example:
1. If the opening price is identical to the closing price of a graphical element, this indicates uncertainty among major trading participants.
2. An intense surge in quotes indicates a local correction is imminent, as the asset will most likely be overbought or oversold, which will trigger the opposite effect.
Subsequently, a trend may form in the direction of the price surge.
The Price Action candlestick analysis system is based on identified patterns in the behavior of currency pair charts.
Evaluating the effectiveness of the most popular candlestick patterns
Every textbook on stock trading tells us that the price chart is the very first source of information a trader should look at, and only then apply any indicators and trading systems.

Indeed, many books are devoted to chart analysis, with candlestick analysis occupying a special hierarchy, since trading without the use of any trading tools is the highest level of skill that almost all beginning traders strive for.
Over time, traders have identified around three dozen different candlestick patterns, many of which actually work, while others have become ineffective as markets change.
However, there are the most popular candlestick patterns, of which there are no more than 5.
They became popular not because of their effectiveness, but only because they are very common and easy to spot.
Trend continuation candles
All textbooks on stock trading, including their author, unanimously tell us  that trading should only be done in the direction of the trend, and never against it.
Indeed, trend trading is the most profitable activity, because if you follow the global market movement, you don't experience the psychological stress of a deposit drawdown, unlike someone who entered a position against it.
It won't take long for your trade profits to increase. It seems simple—you've found a trend and the right entry points—but in practice, we all face challenges.
The biggest problem with trend trading is that you don't know whether you are entering at the top and the final phase of the end of the trend or whether it will continue moving in the same direction.
This is an eternal problem that every trader faces, because you can never be 100% sure whether a trend will move in one direction or not.
Reversal candlestick combinations
The vast majority of traders never pay attention to candlestick  patterns when trading. For them, Japanese candlesticks are nothing more than a representation of the price movement over a certain period of time.
However, more experienced players know that patterns can carry a lot of information about an impending storm, about the weakness of bulls and bears at a certain moment, and, strangely enough, about a possible price reversal.
There are a very large number of candlestick combinations; if my memory serves me right, there are more than thirty of them, and the information on how to use them does not fit even in a two-hundred-page textbook.
However, despite the wide variety of candlestick patterns, no more than ten are actively used by traders, and if we talk about reversal patterns, then if five are in use, that's good.
Candlestick combination "Three Southern Stars".
On a candlestick chart, the distance between the opening and closing prices of a time frame is of no small importance.
Acceleration has always been considered a confirmation of an existing trend, while a slowing trend always indicates a weakening trend.
Candlestick patterns often form during such weakening periods, one such pattern being the "Three Southern Stars."
This candlestick pattern consists of three bearish Japanese candlesticks, each smaller than the previous one.
The development scenario is as follows:
In a downtrend, the first candle to appear is a long bearish candle with a long lower shadow, while the upper shadow is absent, which indicates that the price never exceeded the opening price during the formation of the Japanese candle.
Three Black Crows Candles
The "Three Black Crows" pattern is a set of three descending Japanese candlesticks. This combination is a sign of a strong downtrend and 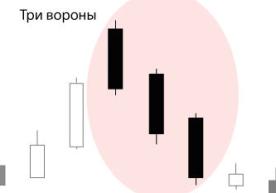 a price decline.
of
the pattern: Three black patterns appear after an uptrend, opening at or near the close of the previous day.
In reality, the pattern in its classic form is extremely rare, so some deviations from the rules are considered.
The shape makes it clear that this formation shows the start of extraordinary selling that has begun in the market.
Market participants close long positions, and the underlying trend reverses.
Candlestick pattern - "Grab by the Belt".
This candlestick pattern has many names—Yorikiri, Belt Grab, Clasp—but all of them share a common 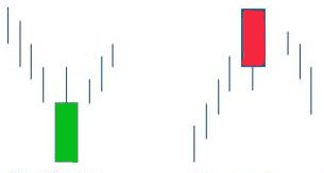 appearance.
This pattern's formation follows a rather complex pattern, making it quite rare. One of the conditions for its occurrence is the presence of a gap in the direction of the existing trend.
The scenario itself looks like this: first, a fairly large price gap appears in the direction of the existing trend during an uptrend or downtrend. The price then immediately begins to move counter to the existing trend, forming a fairly long candlestick.
Three White Soldiers candlestick pattern
One of the most significant candlestick patterns among traders is the "Three White Soldiers" candlestick pattern. For those expecting an uptrend  , this is an important sign. This pattern often appears in currency price charts.
The main signs that indicate the emergence of this candlestick pattern are a downward trend with three connected Japanese candlesticks, each with a long body extending across the main line.
All new candlesticks open opposite the midpoint of the previous period's body, then the pattern itself forms, resembling a staircase, after which the trend begins to rise.
If all candlesticks close in the area of the highest price in the short term, one of the signs that signals are strengthening occurs.
Candlestick combination "Three Stars".
The appearance of stars is quite difficult to miss on the trading terminal chart, although this combination of candlesticks is quite 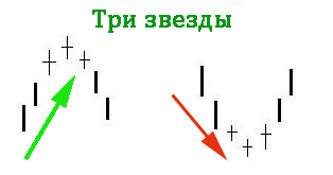 rare, and the resulting reversal signal requires confirmation from other sources.
Three Stars are three consecutive Japanese Doji candlesticks, virtually devoid of bodies and with short shadows.
This combination can occur in both uptrends and downtrends, as the Doji itself indicates market indecisiveness; three consecutive Japanese candlesticks only emphasize this fact.
If we consider the process of the appearance of the Three Stars, the situation usually develops according to the following scenario.
Candle figure "Abandoned baby".
A rare pattern with a plaintive name is a fairly strong signal of a trend reversal, especially if 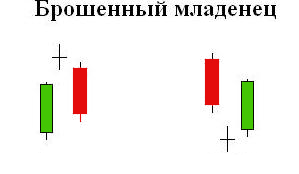 all the conditions for its formation are fully met.
The Abandoned Baby pattern consists of three Japanese candlesticks: the first long candlestick is a trending candlestick, the second is the baby itself (a doji candlestick) with a minimal body, and the third is already formed in the direction of the new trend.
Abandoned baby can be of two types:
• Abandoned baby of the top - occurs during a downward trend, which ends with a long bearish candle, then a sharp jump in price (gap) follows and a doji is formed, after which there is another price gap and a bullish timeframe is formed.
Bearish and bullish engulfing.
Engulfing combinations are among the most powerful reversal candlestick patterns, due to the very process by which they form. 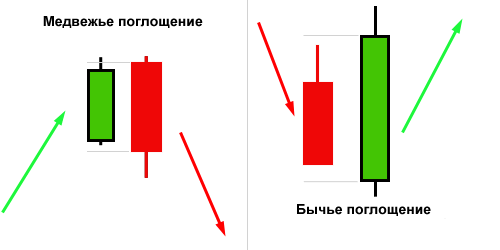 Bearish and bullish engulfing combinations are mirror images of each other and appear depending on the trend direction. When they form, the first candlestick to appear is a trending candlestick with a small body and short shadows. This typically indicates a decrease in volatility on the selected time frame.
Reversal candles - "Hammer and Hanged Man".
These two virtually indistinguishable Japanese candlesticks have long been recognized as harbingers of a reversal, although 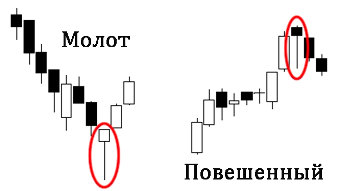 confirmation is required for a more accurate forecast.
Hammer and Hanging Man have a relatively small body and only a lower shadow, which indicates how much lower the low is than the closing or opening price, while the shadow is several times larger than the main body.
The upper shadow is completely absent, meaning the closing (opening) price is higher than the high for the given time frame.
The candle can be either ascending or descending, the direction of the short-term trend is of decisive importance.
Japanese candlestick stars
I use this name not only for a single candle, but for a whole combination of candles that exist under certain  conditions.
The "Star" candlestick has a small body; when it is formed, there must be a price gap with the previouscandlestick.
This phenomenon gives greater weight to the newly formed candlestick.
Ideally, the price gap should exceed the size of the shadow, but this is not a requirement for identifying a Japanese candlestick.
Stars are considered reversal candlestick patterns, which only emphasizes their value; the signal is strengthened if the resulting candlestick has a different direction of movement than the previous one.
Doji candles.
Doji are one of the most well-known combinations, whether it's because of their name, their frequent appearance on currency pair charts, or perhaps their appearance and variety.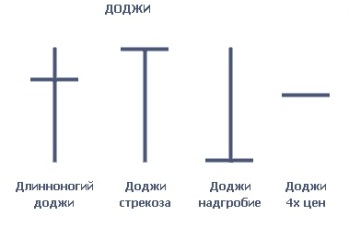 Doji are chart patterns that are almost completely lacking a body, which is their distinctive feature. The lack of a body means that the closing price is almost identical to the opening price, meaning the price has remained virtually unchanged over this period.
Long and short days.
This definition of Japanese candlesticks is quite common in candlestick analysis literature; these terms 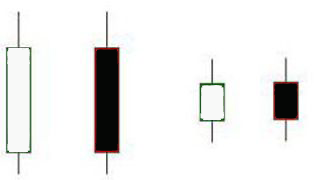 can be considered basic, providing a general description of the candlestick formed.
Long days have a long black or white body, indicating that the price has traveled a significant distance in a day or other time period.
The main role is played by the distance between the opening price and the closing price, but the maximum (minimum) price value is also not ignored.
Marubozu candles.
Japanese Marubozu candlesticks are quite easy to spot on a currency pair chart, which is one of the reasons for their popularity, as traders can immediately 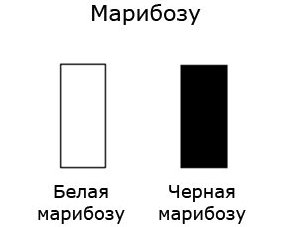 identify such a candlestick and combinations involving it.
Marubozu is a long candlestick with no shadows, meaning its body overlaps the low (high) on a given time frame. There are several variations of Marubozu.
Bearish and bullish Marubozu are variations in which there is no shadow at either the open or close. A black candlestick indicates a downtrend, while a white one indicates an uptrend.
If the candle corresponds to the existing trend, then it is more likely to be a continuation of the trend than the beginning of a reversal.
Marubozu closing candles.
This type of candlestick is one of the most common on candlestick charts. It can indicate either a 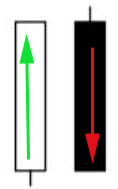 trend continuation or a reversal, depending on its appearance and the combination in which it appears.
Marubozu means "cut," implying that the given timeframe closes at a price higher than the high or lower than the low, depending on the trend direction.
Marubozu come in two varieties: black and white.
Japanese candlesticks spinning tops.
Another type of candlestick that you can often see on technical analysis charts,  this candlestick received such a unique name due to its resemblance to a spinning top.
Spinning tops have a relatively short body and two shadows that are equal and longer than the body itself.
In appearance, they resemble the spinning top we've all seen since childhood, but their structure makes them easily visible on charts.
The candlestick's shape indicates a slowdown in price movement, as the price remained virtually unchanged between the opening and closing prices, despite some fluctuations during their formation.

