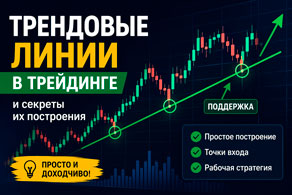
Trend lines in trading and the secrets of their construction
Trading on the stock exchange involves using market analysis tools, which alone can improve trading efficiency.
It is not at all necessary to use complex technical analysis indicators; there are many simple tools that can help in your work.
These tools also include trend lines, which take a couple of minutes to plot, and the resulting results will help you understand where the price is heading.
This is a simple way to determine the market direction, find entry points and notice a change in trend in time, an additional reference point for stop loss and take profit.
A trendline is a straight line on a chart that shows the general direction of price movement. It typically connects two or more price highs or two or more price lows.
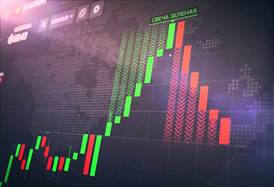
Volumes in exchange trading and their impact on the trend
Exchange trading volumes play a huge role in trading, helping traders determine trends and interest in a particular asset.
What is exchange volume?
In the market, volume is a measure of how much an asset (currency, stock, commodity) is bought or sold in a given period of time.
Today, there are many indicators that can help you analyze the market situation and determine the strength of the existing trend.
Volume indicators show the total amount of trades executed on the exchange over a specific time period. These scripts are one of the most popular tools on the trading platform.
Basics of technical analysis that will help you make money on the stock exchange
Technical analysis is a tool used to study the price behavior of an asset on the stock exchange.

Moreover, it doesn’t really matter what you are going to analyze – the stock market or forex – the trend movement occurs under the influence of the same factors.
Therefore, if you have learned technical analysis while trading on one exchange, you will be able to successfully apply it to other markets.
The fundamentals of technical analysis are designed to provide beginning traders with a basic understanding of how this process works and which tools are best used to improve efficiency.
It's also helpful to learn about systematic approaches and how to correctly formulate conclusions based on the data obtained. So, what are the fundamentals of technical analysis?
What is the Wyckoff Method in trading, part one: the basic principles and 3 laws
Most of us have encountered two methods of market analysis: fundamental and technical.
Each method uses a variety of different tools, but in general, fundamental analysis is about explaining the reasons for trend movements, while technical analysis is about analyzing the history of price movements.
In addition to the two methods we are familiar with, there is another approach to market analysis – the Wyckoff method.
This method includes a variety of trading principles, theories and techniques that allow investors to make rational decisions rather than acting on emotions.
Overbought indicator: buy or sell?
Technical analysis of financial markets includes two very important concepts: “overbought” and “oversold”.
They are used in forecasting absolutely all markets: currency, stock, commodity, precious metals, and the cryptocurrency market.
At first glance, these two market conditions seem very simple, but traders make many mistakes in interpreting them, which leads to losses.
Together with experts from the international broker NPBFX (NEFTEPROMBANKFX), we explored the essence of these two market conditions.
We will tell you everything from A to Z in order.
The Wyckoff Price Cycle, Part Two
According to Wyckoff, investors can understand and predict markets through supply and demand analysis, which is done by studying price, volume, and time behavior.
He described a diagram of the stages of the price cycle, thereby determining the most favorable time to enter.
Accordingly, the time to open a buy order falls at the end of the preparation for an upward trend (the end of the accumulation phase).
And the time to enter a sell position is at the end of the preparation for a downward trend (the end of the segmentation period).
4 stages of the price cycle or Wyckoff price movement
Trading extremes: How to identify them correctly? 3 rules
It's impossible to trade profitably in financial markets without knowing how to "read" market sentiment and find optimal moments to enter a trade.
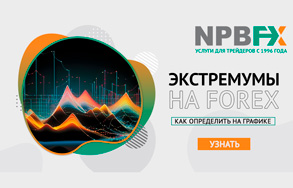
There are many different methods and techniques for this, but the most important tool remains technical analysis.
It's precisely this that allows one to most accurately determine price movement on a chart. The concept of extremes is one of the most important in this type of analysis.
Trading extremes—that's what we'll be discussing today in collaboration with multi-market broker NPBFX.
What are extremes in trading?
You can't do anything without theory. Local extremes are both the maximum and minimum price values over a given period of time.
Wyckoff Chart in the Accumulation and Distribution Phase (Part Three)
This market phase is determined by the price behavior near the support line, which is based on the price lows of the given time frame.
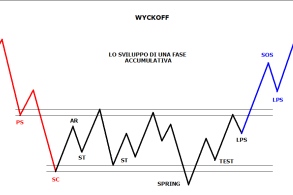
At this point, the price slows down its downward movement, and then begins to move in an upward direction.
Events that occur during the accumulation phase
PS (Preliminary Support) shows the emergence of a significant number of buy trades after a long-term pullback, signaling that the downtrend may be coming to an end.
However, the volume of purchases is not yet sufficient to stop the price from falling further.
SC (Selling Climax – Peak Selling): This is the time when selling pressure reaches its peak.
Wyckoff's Composite Man Concept, Part Four
In the above articles , we have mentioned many times that words like "big man" or "big power" are also called - a composite man in the market.
This aspect is also important in trading; the concept of a composite person is one of the fundamental concepts of the Wyckoff method.
In fact, market makersareindividuals who have great influence on the market, and these include banks, investment companies, credit institutions and other financial organizations.
Essentially, these are investors with large capital, which allows them to significantly influence the volume of supply or demand.
5 Steps to the Market, The Wyckoff Method, Part Five
The Wyckoff Method refers to a 5-step process for entering the market, selecting potential stocks, and placing trades.
Read the first part of the article on the method on the page - Basics of the Wyckoff Method

Step 1: Identify the trend
Trend identification involves determining the current trend and forecasting future price direction by analyzing market structure and supply and demand relationships.
Assessing the future trend will help you decide whether it is worth entering the market at the moment and in which direction to trade?
Fibonacci tools in MT5
The beauty of financial markets is that no trader on the planet is limited in their ability to conduct technical market analysis or in their selection of tools. 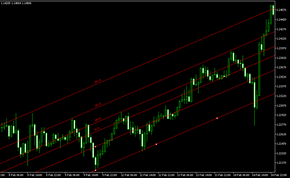
Many of the proposed options previously seemed completely unimaginable, but later gained favor with traders.
The same was true with Fibonacci tools; for a long time, technical analysis using them was met with skepticism, but today the situation has changed radically.
Furthermore, automatic plotting of Fibonacci graphical objects is now possible; this feature is available in the MetaTrader 5 trading terminal.
A brief description of Fibonacci tools
The MT5 trading terminal is a godsend for traders who want to use Fibonacci tools in practice.
Signal indicators for Forex.
Not all beginners are able to independently find entry points into the market, even with the help of technical analysis indicators.
Therefore, if you are not strong in this matter, it will be more rational to use the so-called Signal indicators.
Signal indicators provide clear signals for opening trades; the trader only needs to wait for the right moment and enter the market.
Typically, the operation of such tools is not much different from other indicators; the output of results is simply optimized.
Indicators can add arrows, emit a sound signal, or even send an email or SMS message.
Reversal indicators are the secret to successful trading.
One of the most important events in Forex is a trend reversal, when the price reverses its movement.
A trend reversal allows you to open a position at the onset of a new trend at the most favorable price or close an existing trade at the most favorable rate.
The key is to identify the beginning of a reversal in advance, which is easiest to do using so-called reversal indicators. They help make technical analysis on Forex significantly easier.
The best reversal indicators.
The Chaos indicator – the signal for a reversal for this instrument is the intersection of multi-colored lines; this moment indicates the beginning of a new trend.
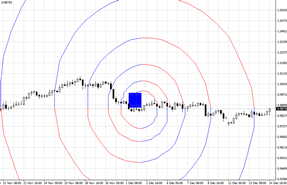
The Fibonacci Spiral: The Magic of Numbers in Market Forecasting
The Fibonacci spiral is a truly mysterious tool for a Forex trader. In fact, when it comes to the Fibonacci sequence and various tools based on it, popular tools include arcs, levels, and the Fibonacci fan.
All of the above-mentioned tools have a history of successful use in technical market analysis, as well as specific training manuals for their use.
What's the point of being overly specific, as all of these tools are available in all trading terminals we know.
However, despite the popularity of all these tools,
the Fibonacci spiral is an exception, as it's practically unused, and no successful trader has written a practical training manual on it.
What is a reversal candle and how to spot candlestick patterns?
Japanese candlesticks are one of the most popular charting methods. They allow traders to assess the market situation, conduct analysis, and determine their next steps.
This is why without the ability to “read” candlesticks it is very difficult to succeed in Forex.
Today, with the support of the dynamic broker NPBFX, we'll explore what a reversal candle is and how to spot reversal candlestick patterns on charts.
Reversal candles are candles that trigger a market trend reversal. To be absolutely certain that a candle is a reversal candle, you need to make sure it follows an uptrend or a downtrend.
Proven Forex trend indicators, a selection of the best scripts
Much has already been said about the importance of identifying the main trend of price movement on Forex. There are many ways to solve this problem, but the most effective remains the use of special scripts.

Trend indicators most accurately determine the direction of an existing trend. Scripts also determine a number of other characteristics used in technical analysis,
such as trend strength and reversal probability, which can be helpful when planning a trade.
There are a huge number of such tools, and the MetaTrader trading platform comes with over a dozen by default.
In addition, there are quite a few trend indicators created by third-party developers; we will try to get acquainted with the most effective of them.
The most effective indicators showing trends
Page 1 of 4
- To the beginning
- Back
- 1
- 2
- 3
- 4
- Forward
- To the end

