The Wedge figure
Using graphical analysis in the Forex market is no less effective in predicting price fluctuations than 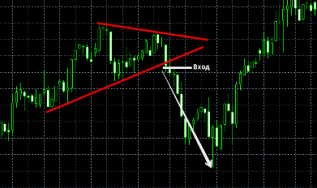 using various indicators or fundamental analysis.
The entire analysis is based on constructing various chart patterns that can indicate a possible continuation or reversal of a trend. Where did these patterns come from, and why are they so widely used?
Graphic analysis was one of the earliest to emerge, so over the course of several decades, traders have noted a number of patterns, which have evolved into teaching aids in the form of various patterns.
The "Wedge" pattern is a reversal pattern in graphical analysis that typically appears at the peak of a trend's end and signals a possible price reversal. There are two types of wedge: bearish and bullish. Each appears in the trends for which they are named.
Constructing the pattern is very simple: you need to draw two trend lines based on the last two or three price highs and lows. The construction is very similar to constructing a regular channel, as we are constructing upper and lower support and resistance lines.
Once constructed, you should have a pattern that closely resembles a wedge. Typically, a wedge points in the direction of the trend itself. If the lines narrow in the opposite direction of the trend, this may indicate the strength of the trend and its continuation.
So how do you trade using the Wedge pattern?
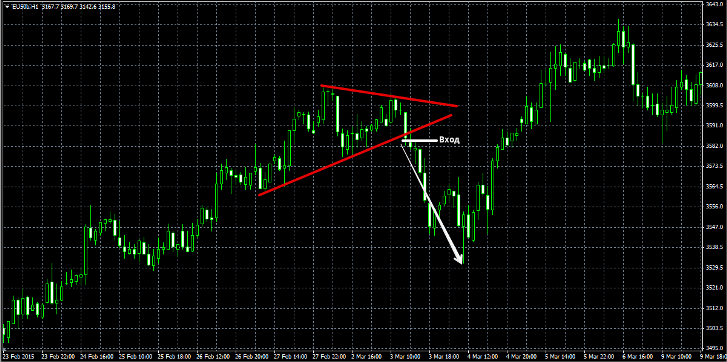
If a wedge forms during a bullish trend, enter a sell position when the price breaks the lower support line. You can see the pattern and entry procedure in more detail in the image below:
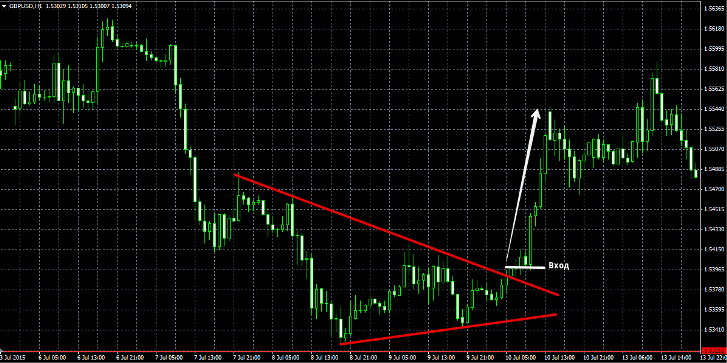
If a wedge has formed during a bearish trend, the entry occurs when the upper line, or more precisely, the resistance line, is broken. An example of a wedge pattern for a bearish market and a buy entry can be seen in the image below:
Entering a position doesn't necessarily require breaking the wedge. Traders often use pending orders.
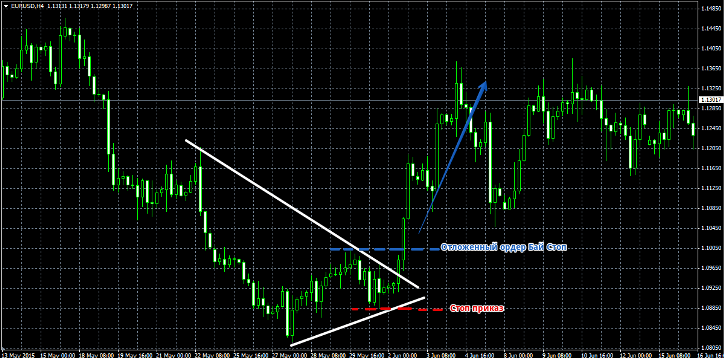
For example, when a bearish wedge appears, a pending buy stop is placed at the local high, along which the resistance signal line is drawn. For a wedge that appears during a bullish trend, a pending sell stop is placed at the nearest local low, along which the support line is drawn.
The stop order is usually placed at the nearest extreme, and the profit is set at least twice the stop order. An example of using a pending order is shown in the image below:
In conclusion, I'd like to say that the wedge pattern can be applied to any time frame and any instrument, whether futures, stocks, or currency pairs. Of course, you don't have to be perfect in applying every chart analysis pattern, but if you see a strong reversal pattern forming, why not take advantage of it? Thank you for your attention, and happy trading!

