MACD Histogram
The MACD histogram is the difference between the MACD line and its signal line: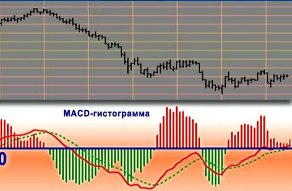
• When the MACD line exceeds the signal line, the histogram is shown with a positive value, exceeding zero;
• When the MACD line is less than the signal line, the histogram crosses zero.
The MACD technical indicator belongs to the class of technical analysis indicators, that is, it is an oscillator and is used to calculate the trend. The MACD histogram is constructed using exponential moving averages (EMA): fast (up to 12) and slow (up to 29). It is depicted on the chart in the form of bars.
If the MACD is above zero and the scale values are increasing, then the market is experiencing upward price movements. If each price peak is lower than the previous one, then the MACD is below zero. This concept was proposed by A. Elder.
If the current scale highs on the histogram close below or above the previous ones, this indicates that the current development is ending, and the market either requires changes or is reversing its activity.
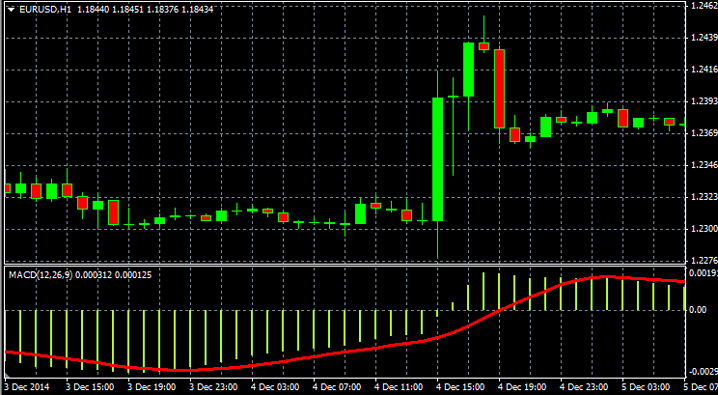
The formation of troughs in the histogram indicates a continuation of the previous signal. MACD crossing the zero line is comparable to the crossing of moving averages. If the crossing occurs from top to bottom, it is a sell signal. If the crossing occurs from bottom to top, it is a buy signal.
Even a Forex novice will immediately understand how to use this tool correctly when searching for successful entry points, especially since the MACD indicator is included in almost every trader's terminal.

