Online charts of currency pairs and cryptocurrencies
A currency pair chart has always been a key tool for technical analysis, allowing one to see both the current price and assess the situation over a specific period of time.
There are several ways to work with charts: in a trader's trading terminal, online currency pair charts, or website informers.
You can, of course, obtain the most comprehensive information from currency pair charts located in trading terminals, but access to such programs is not always available. In this case, you can always use an available alternative.
How to use currency pair charts online?
The online currency pair charts presented are universal and contain information on the following trading instruments: EURUSD, GBPUSD, USDCHF, USDJPY, USDCAD, AUDUSD, NZDUSD, EURGBP, EURJPY, and approximately 50 other currency and cryptocurrency pairs.
Four time frames are available for review: 5 minutes, 1 hour, 1 day, 1 week, and 1 month, almost identical to those in a trader's trading terminal. This approach allows for a more effective assessment of the Forex market situation.
Shorter time frames of 5 minutes and 1 hour are used to assess current trends, while longer time frames allow you to analyze historical price movements for selected currencies or cryptocurrencies. You can
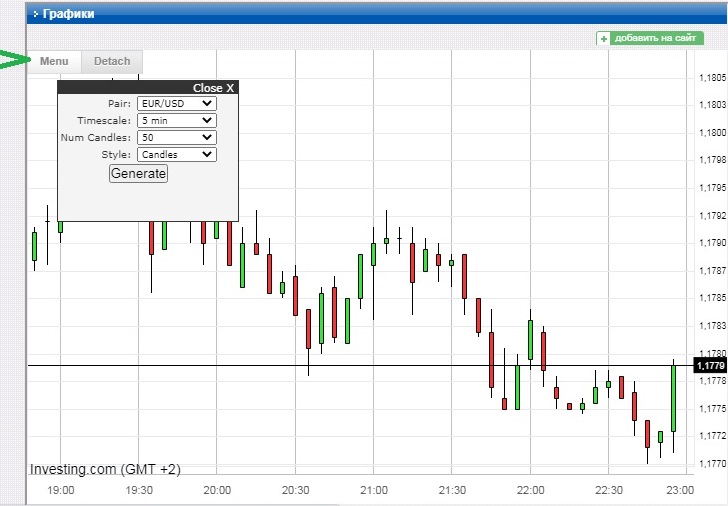
switch between these time frames in the upper left corner of the chart. Hovering your mouse over EUR/USD will reveal two tabs: Menu and Detach. Clicking Menu will reveal a selection:

Here you can change currency pair chart parameters, such as the pair itself, timeframe, and display method— Japanese candlesticks or a simple line.
Trend information is presented in the form of Japanese candlesticks, as this display method provides the most comprehensive information, but you can change the display method to a simple line if needed.

