Fibonacci Fan
All trading applications have a number of tools that are essential for analysis. This group is called "Fibonacci Tools". 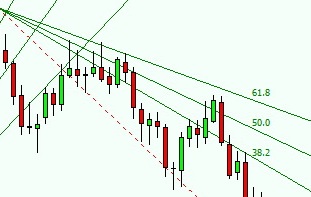 These tools help to design a price map with high accuracy. Among such tools are:
• Fibonacci levels;
• Fibonacci extensions;
• Fibonacci fan;
• Fibonacci channels.
•
These graphical models require correct construction, otherwise their readings will be incorrect and, accordingly, ineffective.
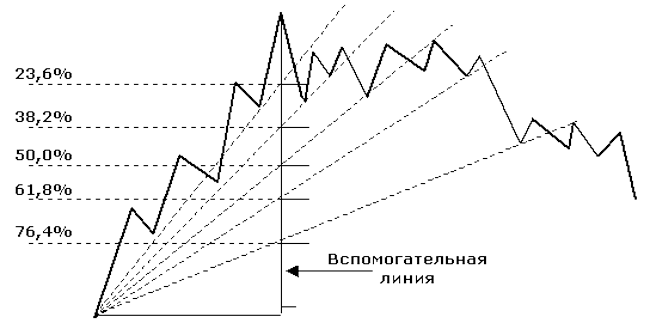
The Fibonacci fan is based on the Fibonacci grid - these are three lines at levels equal to 38.2, 50, 61.8 percent. All lines have a common point, creating a grid of support and resistance lines. On the chart, these lines look like a fan.
To correctly construct a grid, you need to calculate the minimum and maximum price points for a given period. The main line, also known as the trend line, connects at two points. If the trend is just beginning to develop in the market, the line is drawn starting from the minimum and ending with the maximum. If this reaction occurs in the opposite direction—that is, if the trend is declining—the line is drawn from the maximum to the minimum.
Fibonacci levels are positioned at various angles, defining correction levels. These are often used as reference points for placing stop orders or finding market entry points.
The Fibonacci Fan is highly dynamic, so price comparisons are necessary when expanding. This tool shows areas where the price may stop moving and likely reverse its current trend.

