Double Bottom Figure
The double bottom pattern is a reversal pattern most commonly seen in the forex market. It 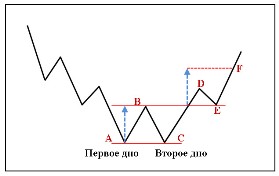 forms in a bearish market when a trend begins to run its course.
All traders know about this pattern, as it's described in books on graphical analysis as the very first of the reversal patterns. Because it's so familiar, the crowd typically acts according to the textbook, so in real trading conditions, it often works.
You encounter it quite often in real life, because unlike the Head and Shoulders reversal pattern, major players don't have to put in as much effort to reverse the trend as they do with the aforementioned pattern.
The "Double Bottom" pattern is formed by two gradual lows, or more simply, two upward pullbacks that form two bottoms in a bear market. The pattern emerges when the price hits a support line, and upon the first rebound, the price attempts to break through it again. If the breakout fails, the pattern is formed, symbolizing the trend's weakness and an imminent reversal.
Visually, they are easy to distinguish, so I recommend looking at an example in the image below:
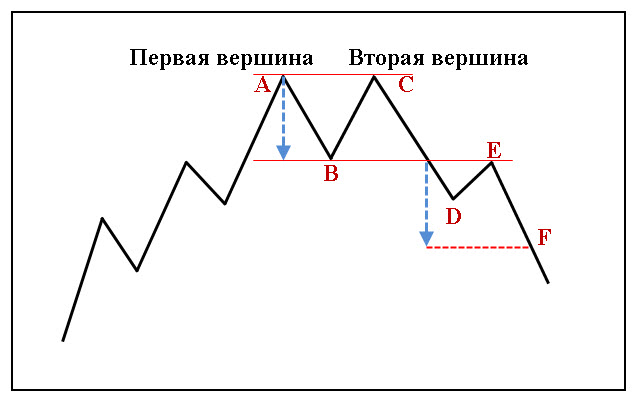
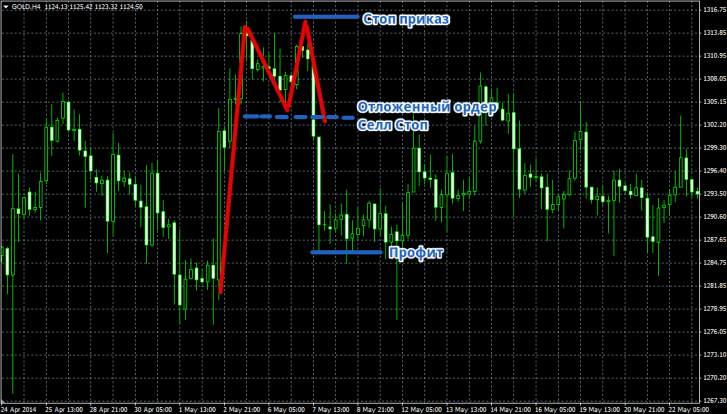
This figure also has a mirror image, called a "Double Top." This figure appears in a bullish market and follows the same construction principle. You can see an example of a mirror image in the image below:
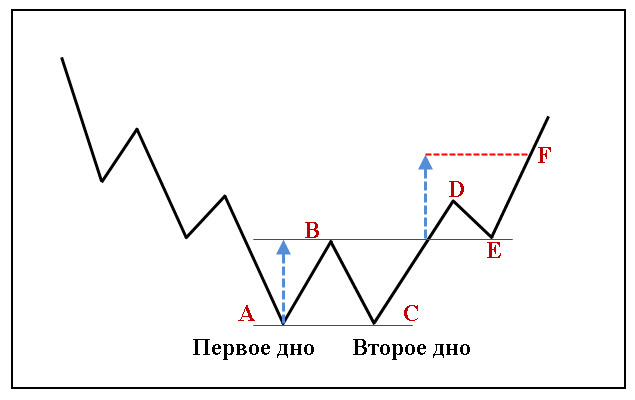
 So how do you actually trade this pattern? The trading rules are very simple: if a double bottom appears, you need to draw a support line at the high formed between the first and second bottoms.
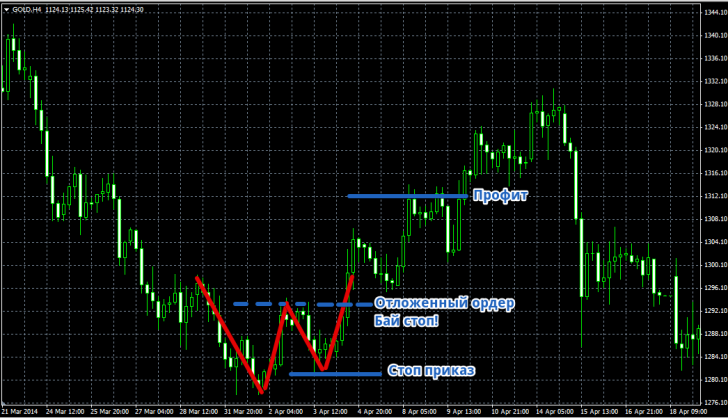
Next, place a buy stop pending order at the support level. The stop order is placed beyond the second bottom, and the profit is equal to the bottom length in points. You can see an example in the image below:
If a "Double Top" pattern appears, you need to draw a support line at the low formed by the two peaks. Then, place a pending sell stop order at this level.
The profit you set is equal to the length of the peak in points. The stop order is placed at the high of the second peak. You can see an example in the image below:
You can also avoid using pending ordersand enter directly after breaking the support line. However, if you use this method, I recommend entering on a closed bar.
The downside of this pattern is that the price hits the support line, so there are times when it simply bounces off, and the trend doesn't reverse. After a bounce, the price can also form a triple bottom pattern, which is also a reversal pattern.
In conclusion, I want to say that the double bottom pattern is a crowd behavior pattern, and the crowd, just like you, sees this pattern and may try to prevent it from forming or simply break it. Therefore, I recommend treating graphical analysis as a complementary tool to your main trading strategy.

