
Sperandeo method
Many critics of technical analysis always argue that the construction of certain figures and lines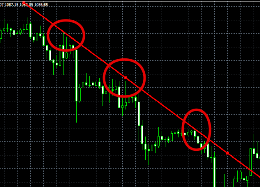 depend on the subjective opinion of the trader.
This kind of analysis does not have clear rules, and if one trader sees support in one place, then another can build it at a completely different point. If we consider the construction of trend lines, the situation is completely sad.
According to the rules, at least two extreme points are required to draw a trend line. But here’s the catch, everyone chooses this extremum for themselves and attaches importance to it, which leads to the line being drawn incorrectly, and its signals are either false or you simply miss the real reversal and enter the market too late.
The famous trader Victor Sparandeo faced such a problem.
The trader became world famous after he published his book, where he proposed his solution to this painful problem. By the way, this is one of the few traders who wrote a book after success on the stock exchange, and not as they do after they suffered a failure in their career. The author of the technique proposed clear rules for constructing trend lines, from which it follows that the trend line is constructed according to successively lowering highs (for a bearish trend) or lows (for a bullish trend) that precede the lowest extreme.
To put it in your own words, you should choose points for plotting not according to a subjective opinion about their importance, but according to two or three extreme points that precede the lowest extreme point (the current drop or rise in price).
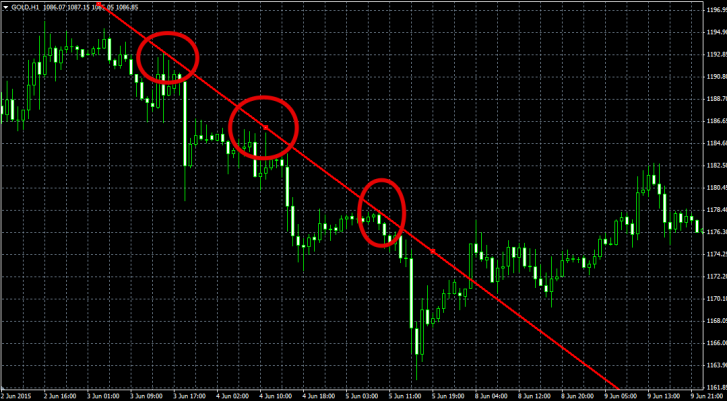
Moreover, the author emphasizes that a point can be considered an extremum if, in a bullish market direction, this minimum was overcome by an upward movement, and in a bearish trend, the maximum was overcome by a downward price movement. Simply put, only those local minimums and maximums for which the price census has occurred. You can see an example of constructing a line using the Sperandeo method in the picture below:
 Based on his construction method, the author came up with his own trading strategy called “Trend change to 1,2,3.”
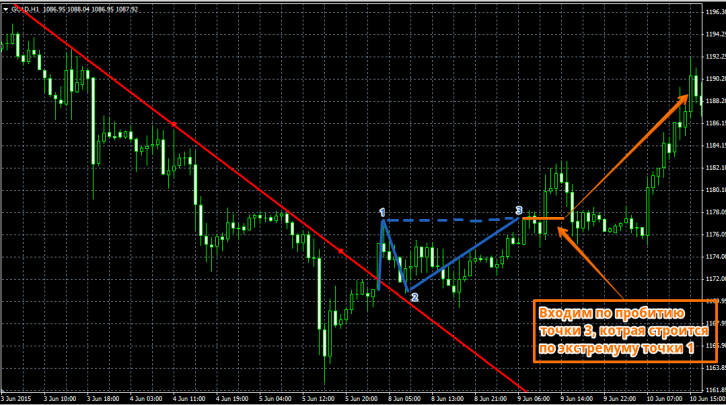
The essence of this method is that when the trend line is broken, it automatically becomes a support line. Based on these observations, taking the 1-2-3 pattern as a basis, the author claims that the trend has changed if three conditions are met:
1. The price has broken through the trend line.
2. As a second step, the price should return to the trend line, which in turn will become its support.
3. The price after the rollback must break through the extremum level, which was formed as a result of breaking the trend line.
Signals to enter the market are generated from these rules . So, we enter a position after the price, after the above movements, breaks through the level that we indicated in the third condition. You can see an example of a login in the picture below:
 With a buy signal, the entry conditions remain the same, the difference is that you will build a trend line with turning points in a bullish market.
A stop order is usually placed at a local minimum and maximum. If you look at how this trading method works on history, you will be pleasantly surprised that you no longer need any indicators to determine a reversal.
Also, this method, in addition to clear points in the market, will always help you to correctly, without any doubt, build trend lines, which are an invaluable tool that has proven itself only on the good side. Thank you for your attention, gentlemen, and I hope you will never again have a question about which points to draw a trend line at.
Good luck!