Fibonacci tools in MT5
The beauty of financial markets is that no trader on the planet is limited in their ability to conduct technical market analysis or in their selection of tools. 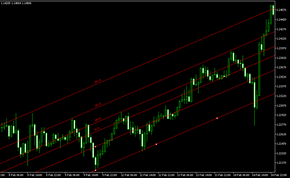
Many of the proposed options previously seemed completely unimaginable, but later gained favor with traders.
The same was true with Fibonacci tools; for a long time, technical analysis using them was met with skepticism, but today the situation has changed radically.
Furthermore, automatic plotting of Fibonacci graphical objects is now possible; this feature is available in the MetaTrader 5 trading terminal.
A brief description of Fibonacci tools
The MT5 trading terminal is a godsend for traders who want to use Fibonacci tools in practice.
These tools allow you to forget about the problems of setting targets forever, and with their help you will always know where the price will approach next.
You can find the Fibonacci tools themselves in your MT5 in the menu “Insert” - “Objects” - “Fibonacci”.
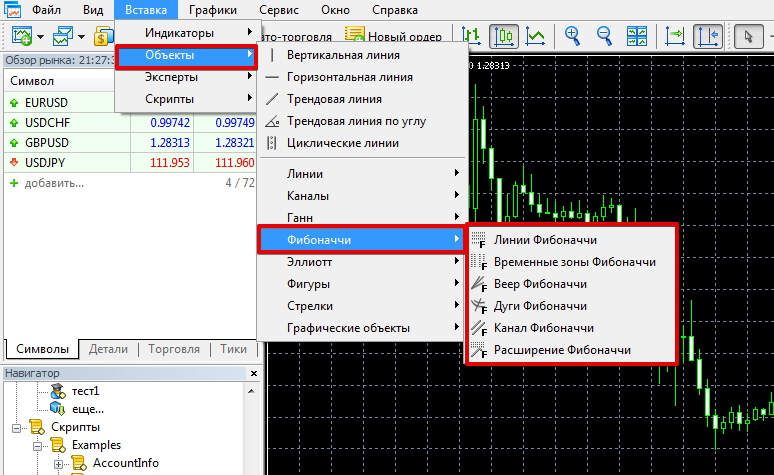
The MT5 trading terminal is represented by the sixth Fibonacci tools - "Fibonacci Lines", "Fibonacci Time Zones", "Fibonacci Fan", "Fibonacci Arcs", "Fibonacci Channel", "Fibonacci Extension".
To give you a general understanding of the purpose and functionality of each Fibonacci tool, we offer a brief description of each.
1. Lines:
This tool performs the main key task of identifying correction levels. Essentially, the "Lines" show the trader the percentage of the marked trend segment that has been corrected.
Key levels are generally considered to be 38.2, 50, and 61.8, as the end of a pullback is highly likely near these levels.
The indicator is very simple to construct: you only need to connect the starting point of the movement and the maximum point of the trend, after reaching which the pullback began.
From a practical standpoint, positions should be opened on a rebound in the direction of the trend continuation from levels 38.2, 50, and 61.8.
A breakout of 61.8 indicates that the formed pullback has become a new trend, and the existing trend has ended. The tool can also be used for placing stop and take stop orders.

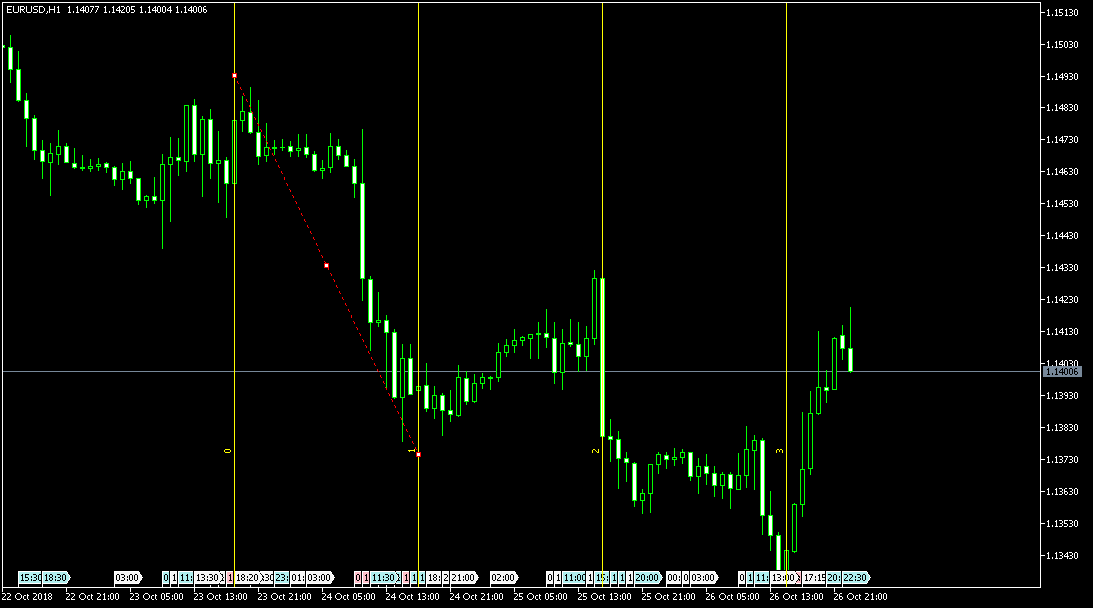
2. Time Zones.
Time zones are a graphical tool whose main purpose is to use vertical levels on the chart to indicate potential instability zones, where a trend is likely to be tested or a surge in activity will occur.
Construction is quite simple: you simply connect a short section of the nearest high and low.
Time zones are one of the most mystical tools, as they don't provide clear action recommendations, but rather indicate possible price changes at certain points.
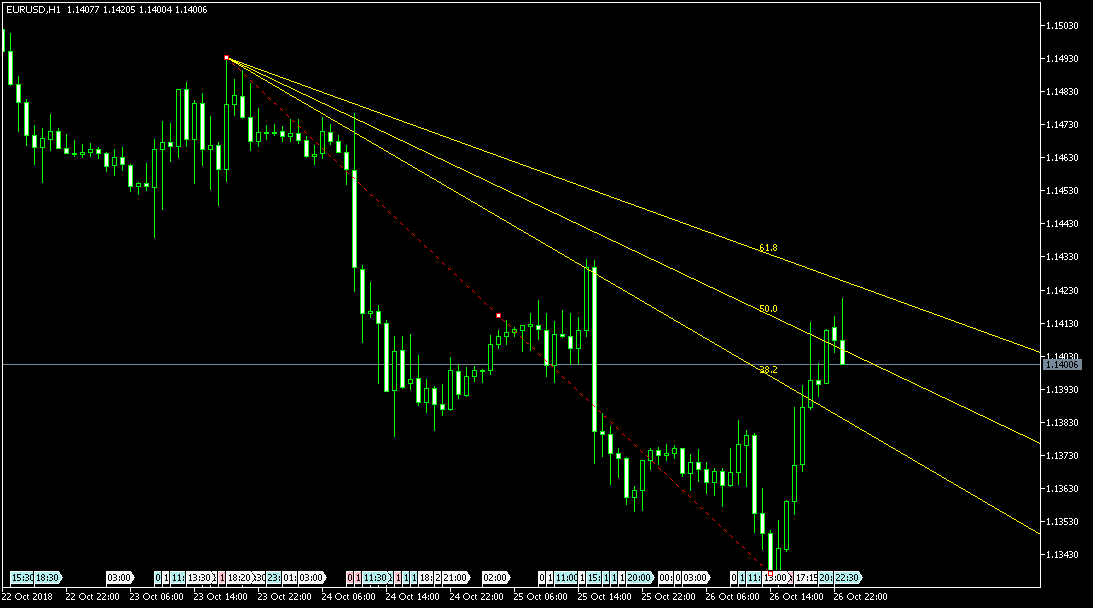
3. Fan.
Unlike the two previous tools, the Fan is a trend-following graphical tool that clearly indicates the trend direction and also shows us the percentage by which the price has deviated from the global trend.
Using a Fan is very similar to trading from trend lines, as positions are generally opened only in the direction of the trend, following a rebound from the levels.
A breakout of the most recent ray is comparable to a trend line breakout signal, indicating a trend reversal.
Constructing a Fan follows the same principle as constructing lines: connecting the high and low points of the selected trend price segment.
When the high point is surpassed by the price, the tool must be rebuilt.
4. Arcs.
Arcs are very similar to fans in their operating principle. Moreover, these tools are often used in pairs, as the intersections of arcs and rays are the strongest support and resistance zones.
Arcs are constructed in the same way as lines: you need to connect two local extremes with a trendline, the correction of which you want to trade.

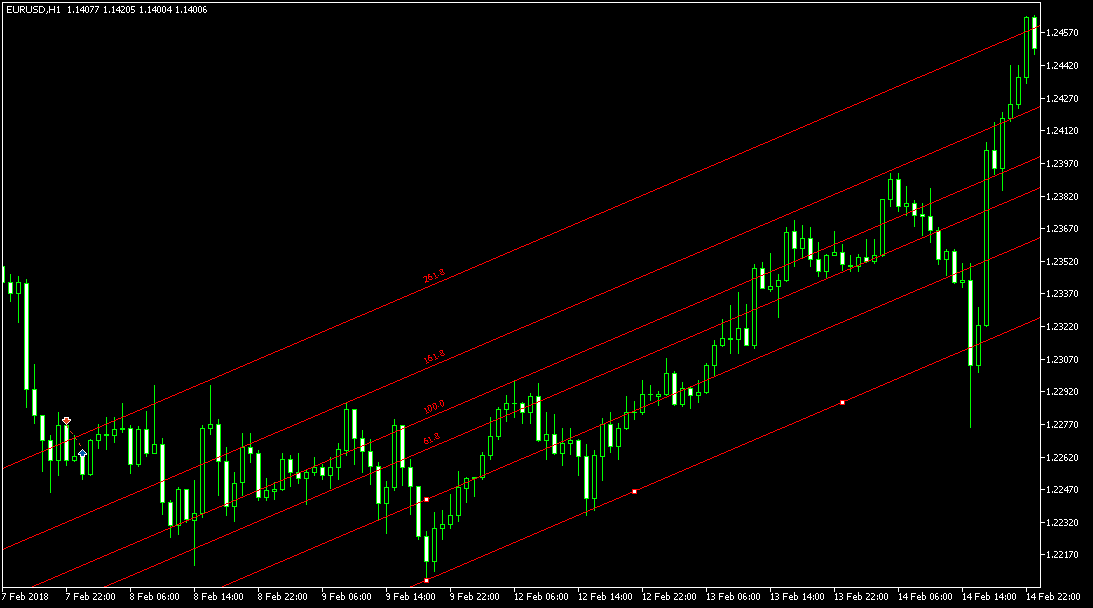
5. Channel.
The Fibonacci channel is practically no different from a classic parallel channel, except that in addition to the range, additional lines are drawn that can act as support and resistance.
It's constructed like a regular parallel channel; to do so, you'll need to place two trend lines parallel to each other at their extremes.
6. Expansion
Extension is one of the main tools in Elliott's wave theory, since it is with its help that the end point of the third wave is determined.
It's also used to clearly define target points and potential price movement. It's constructed using two waves: the first, which initiates the movement, and the second, which is a kind of pullback.

In conclusion, it should be noted that MT5 is one of the most functional terminals currently in existence, and it is here that you will find the widest range of Fibonacci tools.
You can find other interesting tools in the section - http://time-forex.com/skripty

