What is a Forex correction and how to determine its size?
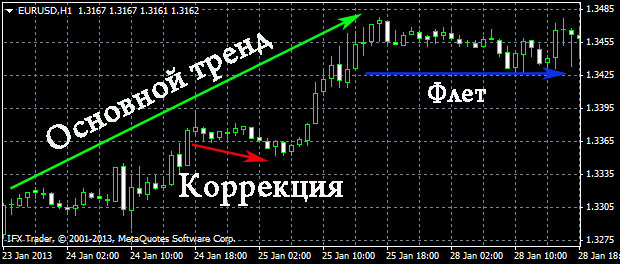
As has been noted many times, the main thing when trading on Forex is to determine the existing direction of the trend.
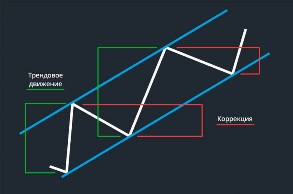
It should be noted that this movement does not always occur in the direction of the existing trend; in addition to the main direction, there is also a correction.
Forex correction is a price rollback against the main direction of the trend, over a certain time period.
Such movements occur both randomly and relatively regularly, and their size depends primarily on the timeframe. A correction in Forex also depends on how sharp and strong the move in the direction of the trend was.
In practical trading, this phenomenon cannot be ignored, as it is often the reason for premature stop loss triggering.
Even if there is an upward trend in the forex, there will still be occasional short-term declines in the price of a currency pair.
This phenomenon is caused by many reasons.
Reasons for Forex corrections
Depending on the timeframe you choose for trading, these reasons may include:
Short-term changes in currency supply or demand; after this change, the price begins to move again in the main direction;
the influence of minor news; not every piece of news can trigger a trend reversal; some events only cause a slight pullback;
and exiting an overbought or oversold state; this usually occurs after a sharp price surge, when the number of orders in the direction of the trend increases to a critical level, followed by a pullback and a resumption of movement.
Magnitude.
Surprisingly, each timeframe exhibits its own forex correction magnitude, which increases proportionally with the timeframe.
The longer the timeframe, the greater the magnitude of this indicator. For example, on M1, the size of a pullback can be just a few pips, while on D1, it can reach hundreds of pips.
This phenomenon stems from the specific way information is displayed in the trading terminal window. For example, on a minute timeframe, you see price behavior over an hour, while on a D1 chart, the window spans several months. Even if the price moves counter-trend for even a single day, it will still appear as a forex correction.
Therefore, while a price decline may appear as a small pullback on one chart, on another, it will appear as a prolonged downtrend.
In addition, it has long been noted that the magnitude of a Forex correction is directly related to the magnitude of the movement in the direction of the main trend.
For example, the trend movement in an hour was 200 points, followed by a rollback of 100 points; after the news release, the trend accelerated and already exceeded 400 points, accordingly, the correction value after such a movement will be 200 points.
Meaning
When deciding whether to trade against the main trend, the correct answer will depend on the timeframe you're using. If it's M1, M5, M15, or M30, it's best to avoid this type of trading and only open trades with the trend.
On longer timeframes, you can switch to a lower timeframe and try your luck.
Following strong news and a sharp jump in exchange rates, as mentioned earlier, a trend correction also occurs on Forex, and its size is almost always proportional to the trend movement. Many traders build entire strategies based on this pattern.
Another important point is that any Forex correction can turn into a trend reversal. There are two ways to check what's really happening in the market: check the latest news, which may have caused the pullback, or analyze the existing trend.
Signs of a reversal are usually a breakout of a support or resistance line, if the price begins to fall (rise) below (above) the latest minimums (maximums).

