5 Steps to the Market, The Wyckoff Method, Part Five
The Wyckoff Method refers to a 5-step process for entering the market, selecting potential stocks, and placing trades.
Read the first part of the article on the method on the page - Basics of the Wyckoff Method

Step 1: Identify the trend
Trend identification involves determining the current trend and forecasting future price direction by analyzing market structure and supply and demand relationships.
Assessing the future trend will help you decide whether it is worth entering the market at the moment and in which direction to trade?
Step 2: Choose trending stocks
These are stocks that have higher percentage gains when the market recovers, and often continue to rise even during a general market correction.
Step 3: Select stocks that have a "Reason" for why they have risen to your price.
The Wyckoff method determines target prices based on the length of the accumulation/distribution period (when the market is moving sideways).
According to the law of cause and effect, the amount of P&F (point and figure chart) that moves sideways within a trading range represents the "multiplier" and the next level of price movement is the "result" for both short and long trades.
Therefore, if you are a long-term investor, you should choose stocks that have been in the accumulation or re-accumulation phase for quite a long time, this will give the asset a chance to reach the expected price.
Step 4: Determine the possibility of price movement
This step is aimed at assessing whether the price is ready to break out of the TR trading range to move up after accumulation or down after distribution:
To determine the likely price movement, Wyckoff proposed nine tests (signals) for buying and selling. These tests provide specific recommendations that help determine when a TR is about to end and a new trend (bullish or bearish) begins.
These 9 tests include price completion events that occur on the accumulation/distribution chart as described above, namely:
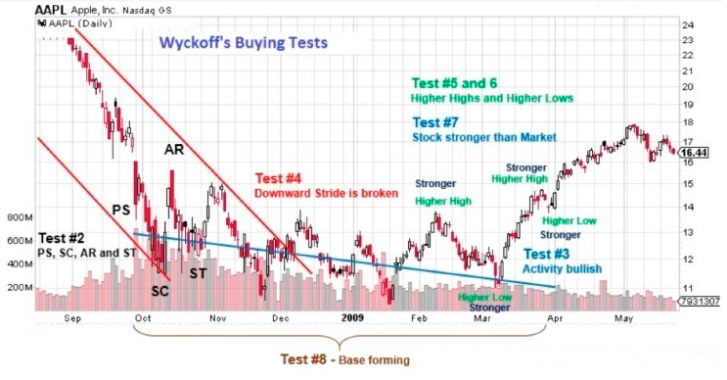
9. Buy Test in the Accumulation Phase: (Including Conditions and Charts Used)
• Bearish target fulfilled, P&F chart.
• PS, SC and ST form, Bar and P&F Chart.
• Bullish activity appears: trading volume increases during the retracement phase and decreases during the correction phase), Histogram.
• Trendline of broken downtrend, bar, or P&F chart.
• Price makes higher low, bar and/or P&F chart.
• Price makes higher high, bar and/or P&F chart.
• Stock outperforms the market (moves higher on retracement and reacts better than the market index), Histogram.
• Base (horizontal price line) forms, meaning the accumulation period is long enough to create a future breakout, bar and/or P&F chart.
• Estimate profit potential at 3x stop loss, Histogram and P&F chart.
Example 9 tests for buying Apple shares in the accumulation phase:
 The 9 sales tests at the distribution stage are performed in reverse order.
Step 5: Determine the time to enter the market
Wyckoff believes that one should enter the market only when the factors of individual stocks match the overall market trend by ¾ or more.
If so, your trade will be more successful thanks to the overall market strength. Furthermore, the specific principles of Wyckoff tests, as well as the price action within the TR trading range, will help investors determine reasonable entry, stop-loss, and take-profit.
Resume
Although the rules and principles of the Wyckoff method are quite simple, applying them in practice is quite difficult.
This article has covered only the basic elements of the Wyckoff method, but this information is sufficient to understand the essence of the method and apply it when choosing promising stocks.
The first part of this article can be found at https://time-forex.com/tehanaliz/metod-wyckoff

