Fibonacci levels, practical points.
Fibonacci retracements are one of the most widely used technical analysis tools for  predicting price corrections. Dozens of books have written about Fibonacci retracements, and the world-renowned wave theory relies on them in one way or another.
However, despite the popularity of the instrument, opinions about it are quite contradictory.
This is connected with the very theory of the instrument's creation, since modern economists and mathematicians simply cannot explain the patterns of movement in financial markets, and the theory of the "Golden Ratio," which is so applicable to both living and non-living nature, is at first glance incompatible with financial markets.
This number is the answer to the riddle of the "Golden Ratio," which can be found in analyzing the construction of pyramids, the human body, and many other natural factors. It is precisely because of this number's mystical presence that the tool known as "Fibonacci Levels" was born, which, surprisingly, works effectively in the forex and stock markets.
Constructing Fibonacci Levels
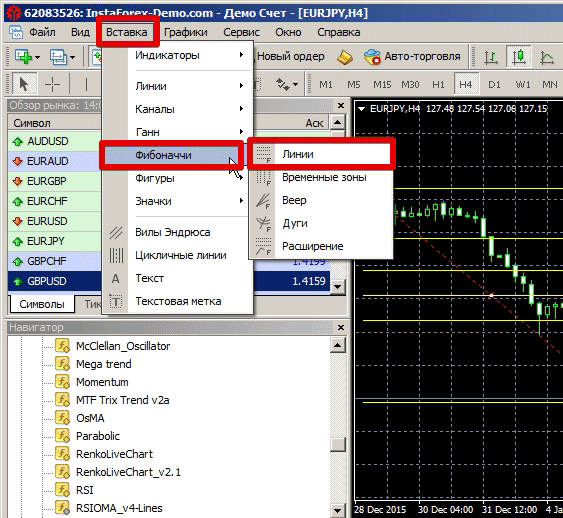
To plot these levels, there is no need to install any additional indicators in the MT4 trading platform, as this tool is built in by default.
To use it, go to the Insert menu, select the Fibonacci section and click on the Fibonacci Lines tool.
How to plot Fibonacci levels correctly?
The most interesting thing is that despite the widespread use of Fibonacci levels, it's quite difficult to find information on how to construct them correctly. However, despite all the fantasies, constructing Fibonacci levels correctly is quite simple.
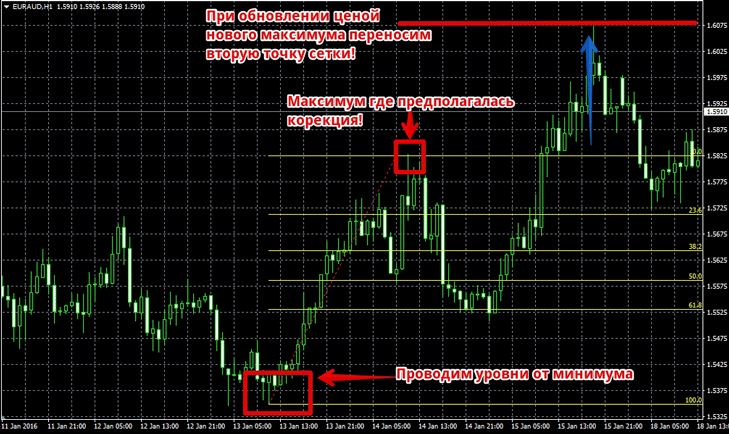
To do this, on an uptrend, you must find the minimum point (minimum) and, without releasing the mouse button, draw the levels to the maximum where you assume a reversal or correction is occurring.
Meanwhile, if the price makes a new high, you should drag the grid to follow it, but there's no need to change the low. In the case of a downtrend, you should highlight the high and draw the levels to the low.
What are Fibonacci levels used for?
As we mentioned above, Fibonacci levels are essential for measuring corrections in the current trend. To understand the full usefulness of this tool, let's consider a simple scenario. For example, you see a clear uptrend in any currency pair or stock, and you decide to buy the asset.
However, you understand perfectly well that there's a very high risk of buying this asset at a very high price, as a pullback or trend reversal could occur at any moment. Therefore, Fibonacci levels are used to determine a clear market entry point, as they show us, in percentage terms, how much the price has retraced from the main trend.
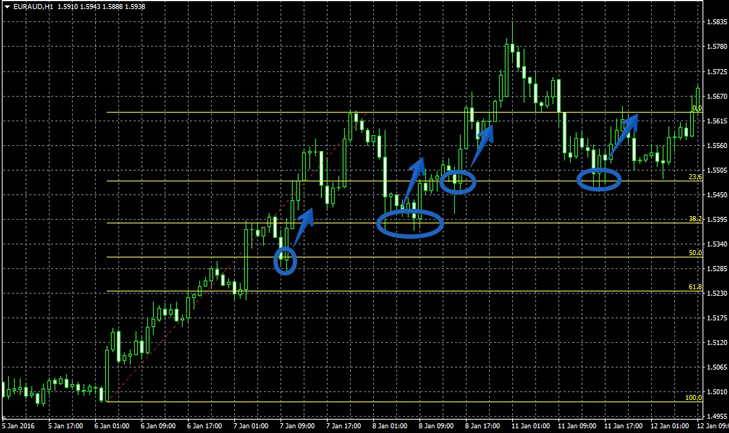
Generally, it's considered appropriate to enter a trend if the price touches the 23.6%, 38.2%, and 50% levels. The 50% level is considered the strongest, and if the price breaks through it, it's safe to say the trend has reversed.
Non-standard application
Although Fibonacci levels are most often used as support and resistance lines, they are often used to determine targets and good places to place stop orders.
The construction principle itself remains unchanged, but all subsequent levels can be considered as good points for setting a profit and stop order.
Disadvantages of using Fibonacci levels
This tool, like all graphical analysis tools, has an inherent drawback: the subjectivity of its construction. Each person may determine the minimum or maximum point for construction differently, especially when it comes to plotting levels on long trending sections.
It is also worth noting that the tool should not be used alone, as its main purpose is to measure trend correction, so Fibonacci levels should be used with another technical analysis tool.

