Bollinger Bands
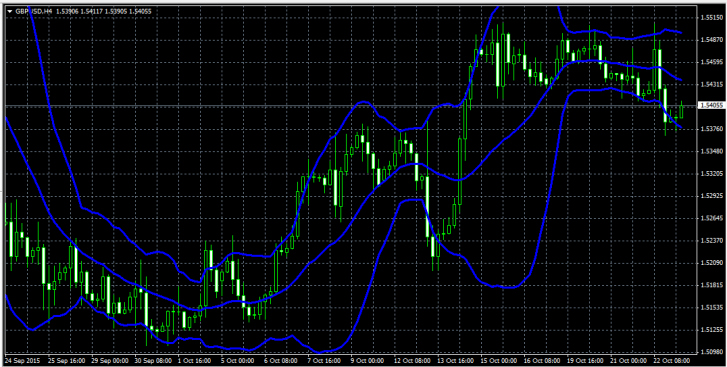
Bollinger Bands are a technical analysis tool, or more precisely, an indicator consisting of three lines that form a channel and show price deviations. The world first learned about Bollinger Bands thanks to the publication of the famous book "Bollinger on Bollinger Bands" by John Bollinger.
In the book, the author describes in detail how to use his tool, provides statistical information, and offers interesting advice to investors that will help them avoid common mistakes.
Initially, the indicator was designed for trading stocks and futures on the stock exchange, but due to its high popularity and effectiveness, the bands also began to be used in the Forex market.
The well-known trading rule of "sell high and buy low" has proven difficult to apply in practice, as it's always difficult to determine the maximum and minimum points. John Bollinger attempted to solve this problem, therefore, the upper line should be taken as the market's minimum, and the upper line as the maximum.
The indicator is considered a trend indicator because it is based on a simple moving average with a period of 20. Many people mistakenly believe that the upper and lower lines have complex calculation formulas, but in fact, the upper line is calculated by adding two standard deviations from the moving average, which is the center line.

The lower line is calculated in a similar way, but in this version, two standard deviations are subtracted from the midline. The indicator's philosophy is crystal clear: the author asserts that price always strives to remain near the mean value, so after sharp spikes in either direction, it always tries to balance out at the midline of the trading channel.
According to Bollinger, the price is within the channel 90 percent of the time, and going beyond its boundaries indicates a strong deviation, which marks a trend.
A distinctive feature of the indicator is that the distance between the lines directly depends on market volatility . For example, when volatility increases, the channel widens, and when it decreases, it narrows. Therefore, with the indicator, you can determine whether a trend is raging or the market is accumulating strength. Bollinger argued that every narrowing of the channel should be followed by a strong price surge, and every strong expansion of the channel will soon be followed by a flat market.
Most beginners building a system based on this tool mistakenly add volatility and trend indicators. However, since both of these functions are already included in the formula itself, the indicators' purposes are duplicated, which complicates the trading system without improving its effectiveness. Therefore, Bollinger Bands should be combined with an oscillator.
This tool is built into well-known trading platforms by default, and in the MT4 trading terminal you can find it in the trend indicators section, where it is called "Bollinger Bands." By default, the indicator uses a moving average with a period of 20 and a deviation of 2, but the tool's author suggests an alternative for short-term trading on a small time frame: a moving average period of 10 and a deviation of 1.9, and for long-term trading on higher time frames: a moving average period of 50 and a deviation of 2.1.
The indicator is very popular among various traders due to its multifunctionality. In the next article, we'll explore the indicator's use in trading and use examples to demonstrate the trading signals it generates.

