Gann line
A Gann line is a line drawn at a 45° angle. The concept was developed by William D. Gann, a successful broker who 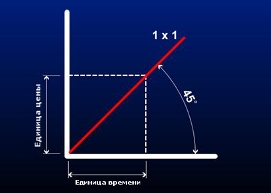 traded stocks and various commodities.
He applied mathematical and geometric rules to his analysis. The trader's work is based on the relationship between time and price. In his research, he placed great emphasis on the highest and lowest points.
Gann lines are trend lines drawn at an angle from the highest or lowest point. The angles are calculated based on price and period. When constructing a 45° angle on an uptrend, the lowest point is determined and a line drawn upward. In a downtrend, a line extends from the highest point to the right and downward. The Gann line provides an equal balance between time and price.
According to Gann Theory, a line with a 45° slope is a long-term trend line. If the price is above the rising line, the market is in a bullish trend. If the price is below the falling line, the market is in a bearish trend.
When the Gann Line intersects the price chart, it indicates a reversal in the overall trend. If, during an uptrend , the price falls to the Gann Line, the price and period are in balance.

A further breakout of the Gann Line from top to bottom may indicate an imbalance and the emergence of a flat or a new, downward trend. To plot this line, a standard tool is typically used, located in the trader's terminal, under the "Insert" menu at the top.

