Gann Grid
The Gann grid consists of trends arranged at a 45-degree angle. According to Gann's concept, the 45-degree line represents a long-term trend line. As long as the price remains above the rising line, the market is in a bullish trend.
When prices are below the falling line, a bearish trend begins. If the Gann lines intersect, this indicates a reversal of the overall trend.
The Gann Grid is constructed using the same rules as Gann Lines. The starting and ending points of the Gann grid are located at the maximum and minimum price levels. They are often located at the opposite level from the minimum and maximum prices. It is also possible to construct a chart with lines from the maximum to the minimum price or from the point of price disappearance to the point of reappearance at a certain frequency.
The Gann grid works by analyzing the diamond sides. The key is to track price fluctuations along the line, where the diamonds intersect, looking for justification and logic behind the movements.
The Gann grid is a powerful market research tool developed by a trader. It is often used with other technical analysis indicators.
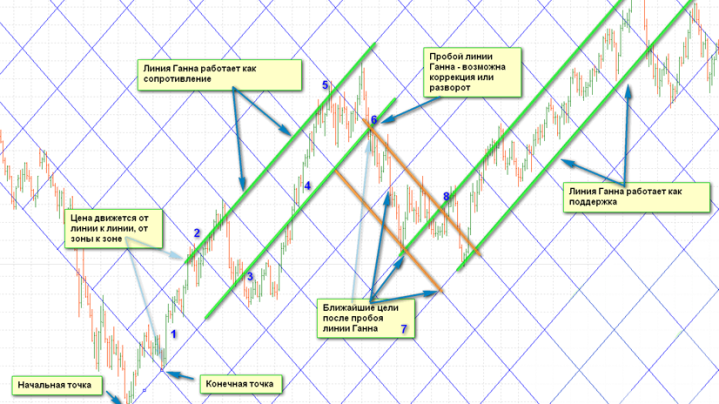
The use of such a graphical construction is quite simple, this is clearly shown in the example above; in fact, the grid lines form price channels, the boundaries of which are the main guidelines when opening transactions, while standard strategies for breakout or trading within the channel are used.
The construction itself is carried out using the MetaTrader 4 terminal or a special indicator.

