Pennants and flags in Forex.
The use of graphical analysis often causes controversy among traders, but most are still inclined to believe that it also contains figures that predict trend behavior with relatively high accuracy.
The pennant and flag fall into this category of figures; the appearance of such figures on a currency pair chart allows you to prepare for a successful trade and take measures to insure an existing position.
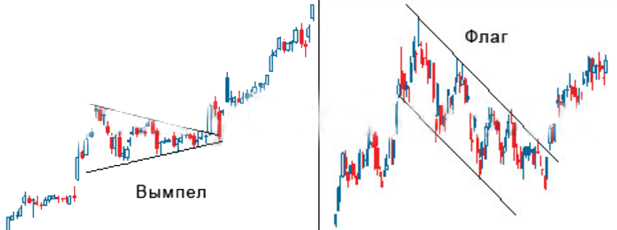
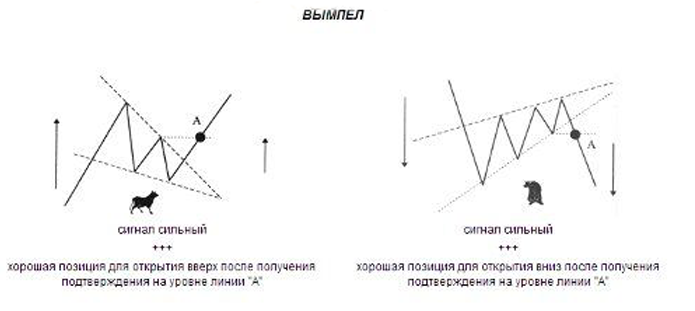
Pennants and flags are narrow consolidation phases that remain within a trend for a very short time. If the pattern is outlined by parallel lines, it is called a flag; if these lines converge, it is a pennant. Beginner traders often confuse pennants with triangles, but there are differences between them. Pennants form significantly faster.
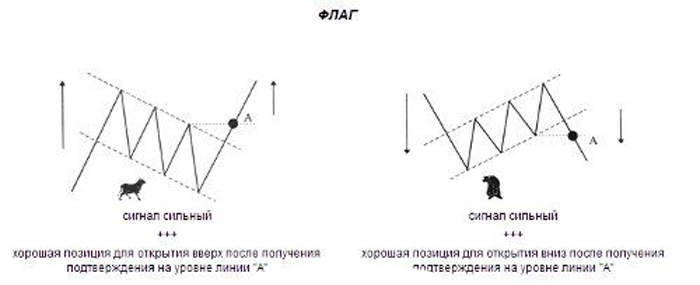
If you see one of these patterns, it indicates that a strong trend is taking a short break. A breakout of one of these patterns can mean two things: either the trend will continue moving, or it's a signal to start trading in the direction of the trend.
Since breakouts typically follow a trend, many experts advise trading before a Forex breakout. This gives traders the opportunity to operate under more favorable conditions. If you see a flag or pennant broken at the bottom of the pattern, this point should be designated as a protective stop.
A significant breakout of the boundaries of these patterns from unexpected directions indicates a strong signal for a trend reversal.
Trading experience shows that in most cases, these patterns are directed against the main trend. However, this same experience suggests that the direction of the flag (pennant) is not particularly significant.
If one of these patterns is near the upper line of the trading range, this may indicate significant bullish sentiment. If flags (pennants) appear directly below the boundary of this range, this indicates that the market has reached its top but is not yet retreating.
In this case, the market is said to be preparing for an upward breakout. If the patterns in question form above the range line, this indicates an increased probability of a possible breakout.

