Relative Strength Index (RSI).
The Relative Strength Index is one of the most popular indicators that works well in the trading market.

This name was given to the term by its developer, Welles Wilder. The formula for determining the indicator consists of two values:
• U (n) is the sum of positive price changes at the end of n intervals,
• D (n) is the sum of negative price changes for those time intervals in which sales ended at a reduced cost compared to the previous period.
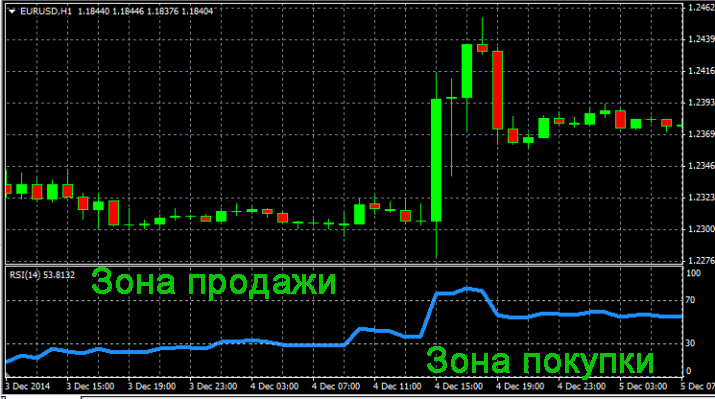
Thus, the relative strength index (RSI) shows the dynamics of price changes in the direction of their movement, converts the cost into a percentage, showing places of purchase (up to 30%) and sale (over 70%).
Like the stochastic oscillator, which is a well-known technical term, the relative strength index (RSI) determines the actual value of the item being analyzed compared to historical prices. In stochastics, the relative strength index is defined as a percentage, representing the full supply and demand limits, above or below which the indicator does not fall.
This indicator is unlike other existing indicators that determine the relative strength of price changes. Most oscillators use more than one price to determine the strength of a particular index relative to another. The relative strength index, however, only uses historical data for the underlying asset, thereby revealing its strength relative to its own performance.
Method for determining the relative strength index
When calculating the relative strength index (RSI), only price information and a single indicator that quantifies the amount of past price data are used. Therefore, the more information available, the more reliable the indicator. Welles Wilder preferred using 14 periods when calculating the relative strength index. However, any other relative scale can be used, including frequency, expected forecast duration, period of information analyzed, inherent advantages, and so on.
To calculate the relative strength index, you need to identify the closing periods that generated profits from previous periods whose prices have declined relative to the previous period. In other words, before beginning the analysis, you need to study the closing prices of all indicators from previous periods. Following the suggestions, you need to examine 14 previous prices and categorize them into groups that include both gains and losses.
Next, you need to calculate the total amount of increase and decrease and start calculating the RSI.
The average price increase and decrease over previous periods is crucial for calculating the relative strength index. Furthermore, given specific price data, the indicator can only be calculated for the first period, as the remaining time periods will be used to calculate the average increase or decrease for the first RSI determination.
To determine the average growth and decline of the initial period, you need to begin with a general calculation of the average increases and decreases. The average growth in each period is the sum of the current profit (loss) and the overall average increase (decrease) for the previous period, multiplied by the first period's indicator and divided by the overall indicator.
Then, for each interval, divide the average increase by the average decrease. This yields the relative strength. Add 1 to the given number, place the resulting sum in the denominator, and 100 in the numerator. Then subtract the resulting fraction from 100, yielding the relative strength index for the current period.
Using the RSI indicator is similar to working with the Stochastic Oscillator: sell in the overbought zone above 70, and sell in the oversold zone below 30. The price should reverse and attempt to leave one of the zones. The proximity of the price to these zones and the direction in which it is moving also serve as a guide when opening trades. You can find other useful technical analysis tools in the Forex indicators.

