Overbought and oversold, how to identify these market conditions
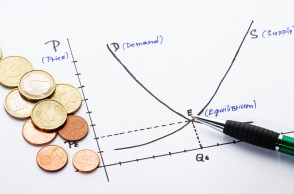
The main factors that influence market prices are supply and demand; changes in their values have the greatest impact on the value of stocks, currencies, and commodities.
However, the market does not always react to this event with an immediate reversal; there are points or zones at which a moment occurs when the price of an asset does not suit buyers or sellers.
Such periods are called overbought and oversold market conditions.
An overbought market is the moment when the price growth stops, as the number of people willing to buy the asset is practically reduced to a minimum, and the number of people willing to sell it begins to grow.
In relation to Forex, this indicator is characterized by the number of open sell orders; when it reaches its maximum level, the price refuses to rise any further and traders begin to make short trades.
This leads to an increase in the currency supply and, consequently, a downward trend in the Forex market. To monitor the number of open orders, a special "Traders' Open Positions"
An oversold market is the opposite of the previous indicator; it occurs when the price of a currency pair reaches its minimum and has no opportunity to decline further.
This indicates that demand is currently beginning to exceed supply. The asset's price has reached its minimum price and is now acceptable to most buyers, which is a signal to open buy orders.
At the same time, the number of people willing to enter into a sale transaction begins to fall and the supply quickly decreases.
How to determine overbought and oversold conditions using specific examples
To better illustrate this, let's look at a specific example. The EUR/USD currency pair is experiencing an upward trend . The price is steadily rising, but there are no factors stimulating this growth. Eventually, a point comes when no one wants to open trades at this price.
Traders understand that it has reached its maximum and are closing previously opened buy orders, which causes an even greater weakening of the trend and, as a result, its reversal.
After a reversal, the number of sell orders increases dramatically, continuing to grow until the price enters the oversold zone, where the process repeats in reverse.
It's worth noting that a trend reversal doesn't always occur in the overbought and oversold zones; it's often triggered by strong news or a sharp change in currency supply (demand). Therefore, you can't rely solely on overbought and oversold analysis in trading.
The primary tool for identifying these moments in the Forex market is the Stochastic indicator, which can be found in any trader's terminal. It's part of the standard toolkit, so to speak.

As can be seen in the figure, the overbought zone has parameters from 80 to 100, and the oversold zone from 20 to 0. Buy or sell signals are usually the indicator lines exiting these zones, namely, crossing the 80 or 20 level.
The signal is stronger if the solid line crosses the dotted line when buying from top to bottom, and when selling from bottom to top, and you can notice this yourself by looking at the indicator window.
The truth remains a mystery as to how this script obtains information, so it is advisable to use another signal source to be on the safe side.
Market overbought and oversold conditions have always been a basic guideline when predicting the future behavior of a trend, so it is so important to monitor the phase of the trend when opening trades.
You can find more information about using indicators to determine overbought and oversold conditions here - https://time-forex.com/interes/perekup-pereprod-indik

