Overbought and Oversold in Trading - Indicator for Analysis
In many of the author's books, we are often told that the price that we can observe in the form of a graph is the result of the battle between the Bulls and the Bears.
Indeed, if you look at the market and put aside all the terminology, you understand that the price is formed by both demand, which comes from buyers, and supply, which comes from sellers.
Essentially, the result of such mutual cooperation, and perhaps often competition between both parties, leads to the formation of a schedule. Why competition, you ask?
It's very simple. Imagine a trader is an ordinary market trader. What do sellers try to do? Sell for as high a price as possible, while buyers try to buy for as low a price as possible.
Typically, at such moments, you can observe a price reversal or a move into sideways movement (flat), which can lead to a decision about whose financial flow will drive the price in a certain direction. However, such a reversal doesn't necessarily have to happen immediately, because the market is primarily made up of people who are unsure whether to exit an asset or, conversely, buy more.
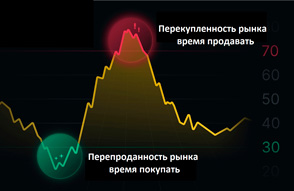
These zones appear when the market starts to slow down and tends to reverse and are called overbought and oversold zones.
Overbought is a unique moment when fewer and fewer people are willing to continue buying an asset, while more and more people are willing to sell at a new high. This zone is often reflected on a chart as a price slowdown, preceded by the formation of a new local high.
Oversold conditions are characterized by a market slowdown, as fewer and fewer people are willing to sell the asset, while more and more buyers are willing to buy at the new, lower price. This zone is often seen after a new local low has formed, followed by a sharp price slowdown or a sideways movement.
Practical Application of Overbought and Oversold in Trading
Now let's talk about what these zones can offer us and how to identify them. First, finding these zones is a unique opportunity to profit from a pullback or even a price reversal. Traders often use various technical indicators, or more specifically, oscillators, to find them.
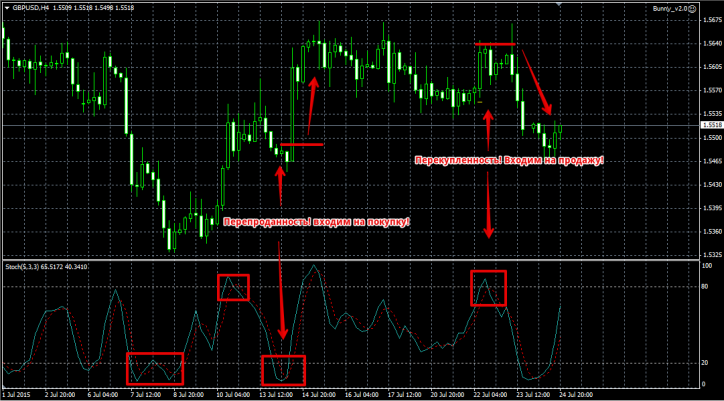
For example, the Stochastic or RSI indicators are specifically designed to detect such zones. For example, if we consider the Stochastic, the overbought zone is considered to be when the indicator line is between 80 and 100.
You can see the oversold zone if the indicator line is between 0 and 20. I think I don't need to explain that this is where we open a sell trade, and in the oversold zone, we open a buy trade. You can see an example of these entry points in the image below:
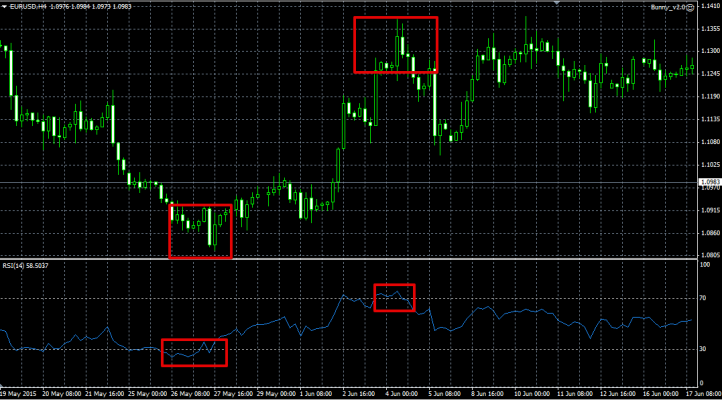
 If you use the RSI indicator, you can find the overbought zone if the indicator line is in the range from 70 to 100, and the oversold zone can be observed if the indicator line is in the range from 0 to 30.
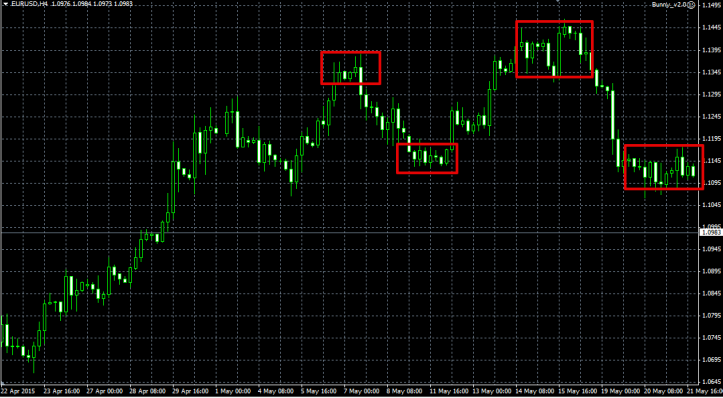
You don't need to use various indicators to find such zones. Simply monitoring the currency pair's chart can help. If you notice an asset slowing down, and then it starts moving sideways, then there's a high probability that this is either an overbought or oversold zone.
However, there are pitfalls when working with these zones that, for some reason, no one wants to tell you about. It often happens that the price appears to have reached a new high, then, as if on cue, slows down and begins an uncertain sideways movement.
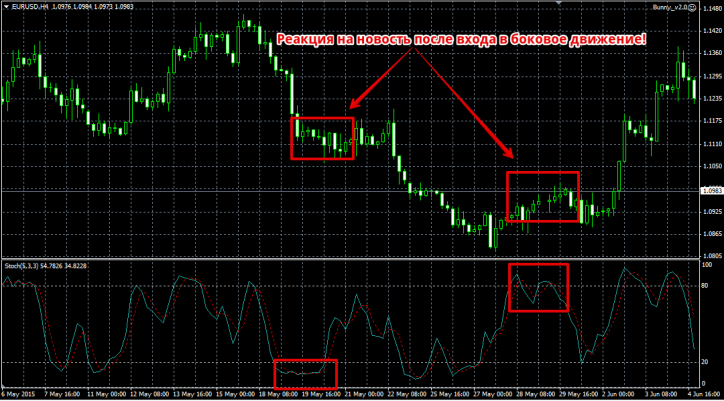
By all indications, you're in the overbought zone, and it would be worth selling. However, perhaps at this point, positive news (positive economic indicators, a report) will be released, and buyers, having gained strength from a minor sideways movement based on this news, will begin buying the asset en masse, anticipating further growth. The same will apply to the indicators used to identify these zones.
To avoid such situations, use an economic calendar and try to avoid entering into positions during strong news releases.
An even better option would be if your prediction of a price reversal is supported by positive or negative news. Thank you for your attention, and apply this knowledge wisely. Good luck!

