Head and Shoulders Figure
The head and shoulders pattern is the most common reversal pattern in graphical 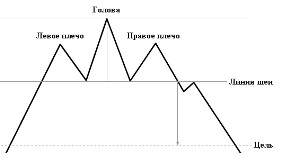 analysis.
Every newcomer to the forex market eventually stumbles upon training on graphical patterns, whether in seminars, books, or simply videos. The basics begin with graphical analysis.
The problem is that many traders use patterns without understanding their origins, much less considering the underlying facts. These patterns emerged from traders' observations, specifically from price movement patterns.
Many people consider patterns to be some kind of super tool, but in reality, they reveal patterns in crowd behavior.
A head and shoulders is a reversal pattern that appears at the top of a trend and consists of three highs. Viewed from the side, it resembles a human head and shoulders, with the central high being higher than the two adjacent highs. It appears in both bullish and bearish trends, with a bullish pattern based on three highs and a bearish pattern based on three lows.
The pattern itself consists of a left shoulder, a head, and a right shoulder. These elements are essential; otherwise, it's a completely different pattern. If you take a closer look at why it occurs, you'll come to the conclusion that it's the work of big players. Indeed, if you observe the moment it occurs, you'll notice that a clear trend has formed at this stage, and only a complete fool would miss it.
Many traders begin to take the bait of such a clear trend and try to enter it, but large players try to hit the stops of those who just entered the market, and thanks to the first shoulder, some traders are forced out of their positions. Then, seeing a small pullback, players buy back the asset, which leads to the formation of the so-called head. However, large players again enter the selling phase, leading to the formation of the right shoulder.
Players, seeing the weakness of this trend, begin dumping their positions en masse and exiting their buys, which ultimately leads to a trend reversal. In general, this is indeed typical crowd behavior in a panic about losing money. You can see an example of a head and shoulders pattern in the image below:
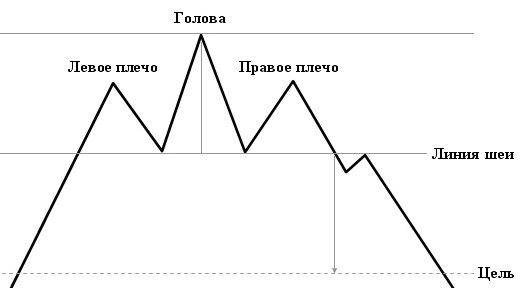 Of course, the figure depicts an idealized version of the pattern, the kind you'd only see in a textbook. In reality, it's important to remember that the Head and Shoulders pattern is primarily a crowd behavior model, and as you've probably already observed on a price chart, such perfect waves simply don't exist. Therefore, your task is to see and find this image and try to transfer it to the chart.
Now let's talk about how to use this graphical tool.
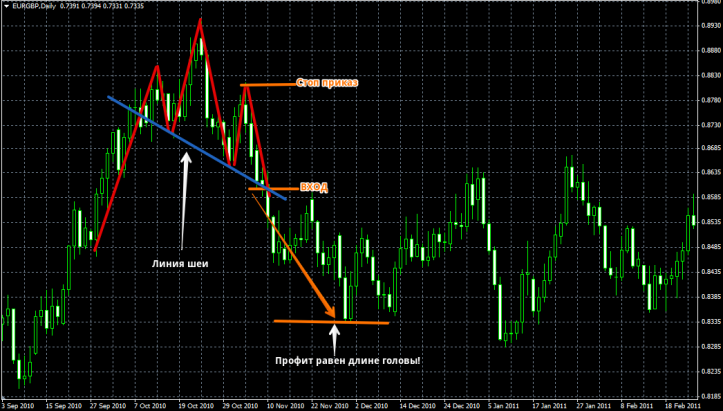
A head and shoulders pattern is emerging in a bullish trend. The next step is to draw the so-called neckline, which connects the two lows that formed the shoulders. This will create a support line of sorts. Now, if the price breaks the neckline, a sell order is placed.
A stop order is placed at the high of the right shoulder, and the profit is usually set equal to the size of the head in points. You can see an example of a sell order in the image below:
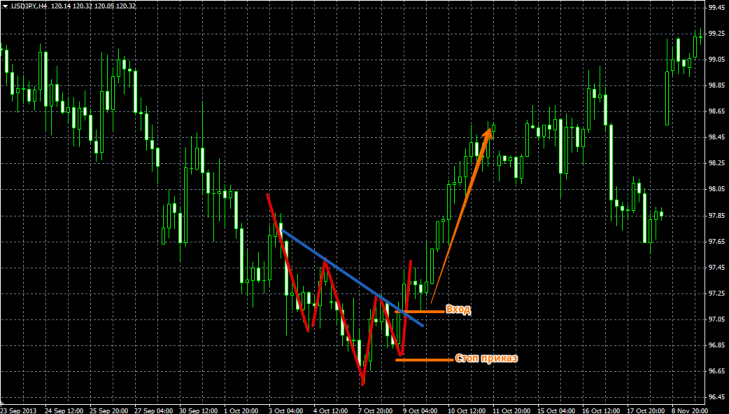
If a head and shoulders pattern appears during a bearish trend, draw a neckline along the two local highs formed by the left and right shoulders. This will create a line that acts as a resistance level.
If the price breaks the neckline from the bottom up, enter a buy position. Place a stop loss at the shoulder level, and set the profit target equal to the size of the head. See the image below for more details:
The main drawback of this pattern is that many beginners, chasing a trend reversal point, see it where it doesn't actually exist.
This is because all graphical analysis is based on a subjective view of the market, so it's not worth chasing this pattern. However, if you do see one, you should be prepared for a trend reversal soon.

