Trading extremes: How to identify them correctly? 3 rules
It's impossible to trade profitably in financial markets without knowing how to "read" market sentiment and find optimal moments to enter a trade.
There are many different methods and techniques for this, but the most important tool remains technical analysis.
It's precisely this that allows one to most accurately determine price movement on a chart. The concept of extremes is one of the most important in this type of analysis.
Trading extremes—that's what we'll be discussing today in collaboration with multi-market broker NPBFX.
What are extremes in trading?
You can't do anything without theory. Local extremes are both the maximum and minimum price values over a given period of time.
It is important to note that these are local ones, since the extreme values for a period of one day and a period of a week can differ significantly.
If you look at any chart, for example, you'll see that the price moves in a very undulating pattern, sometimes even in leaps and bounds. It reaches a high point, dips back down, settles there, and then rises again. These very high and low points can be called extremes.
How are extremes related to the trend? First and foremost, they help us understand the overall price movement on the chart, that is, determine the trend. If each new local extreme is higher (or lower, depending on the direction) than the previous one, this indicates an upward trend (or a downward trend, if the extremes shift downwards).
What else are extremes used for? Besides providing trend information, traders use extremes for various purposes:
- Stop-loss orders. General recommendations: when opening a position, place a stop-loss order slightly away from the nearest price peak. If the market trend is strong, the price is unlikely to return to the previous extreme.
- Price levels. If a large number of price peaks are located at approximately the same level, forming a virtually straight line, this can be used as a benchmark for entering into trades. This works best on larger timeframes.
- Channels. Extreme values form channels within which price movement occurs. The upper boundary is formed by a straight line of price highs, and the lower boundary is formed by a straight line of price lows. This information allows one to estimate profits and potential risks.
How to correctly identify extremes on a chart?
There are no set rules for identifying extremes in MT4. This is primarily because, with experience, traders learn to spot the necessary points very quickly simply by glancing at the chart. We've compiled a few recommendations to help you avoid making the wrong choice.
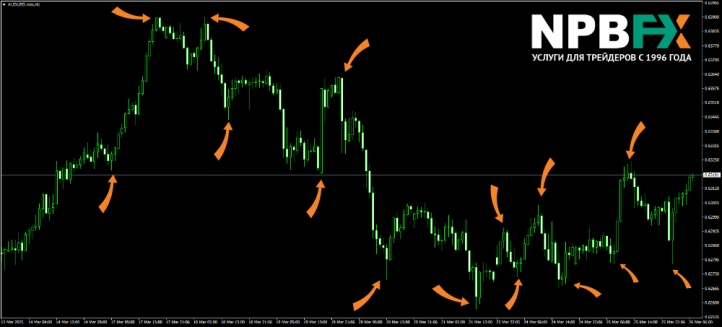
- Visually identify key points on the chart. It would seem the most obvious thing to do is simply glance at the chart and identify the highest and lowest points. Let's visualize this as follows: take the first available chart of an instrument with the first available timeframe. In our case, this is AUDUSD with the H1 timeframe. Several key points clearly stand out; these are most likely local extremes.
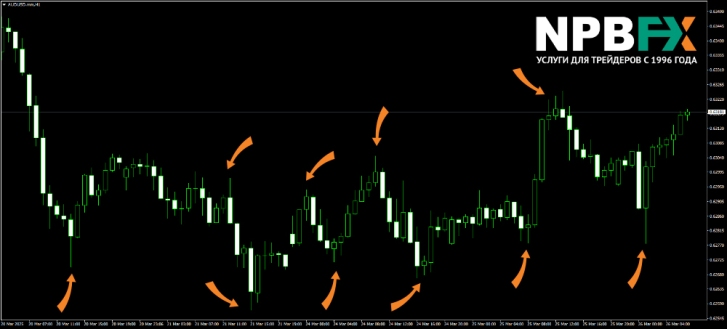
- Determine the desired time period and find the points. Let's say we need to identify the minimum and maximum points over the past five days. In this case, using a dated chart, we'll highlight the area of interest and then find the highest and lowest points within that area.
- Check your decision using indicators. But what if you have doubts? For example, are these points on the chart extremes?
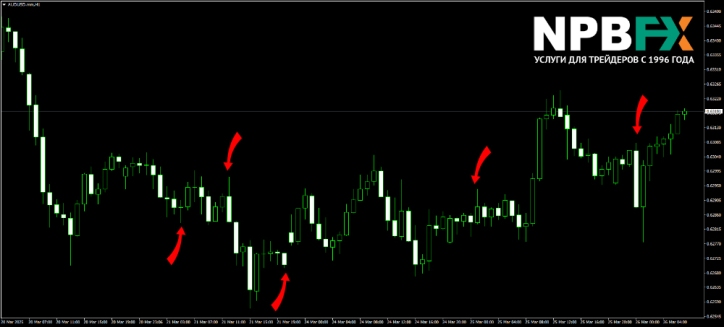
It seems to meet all the requirements – it's a local "peak" or "bottom" like any other, it's just less obvious. To determine whether this point is an extreme or not, it's best to use additional indicators – there are many, but today we'll look at two of the most popular. One is for finding large numbers of local highs and lows, and the other is for more global extremes.
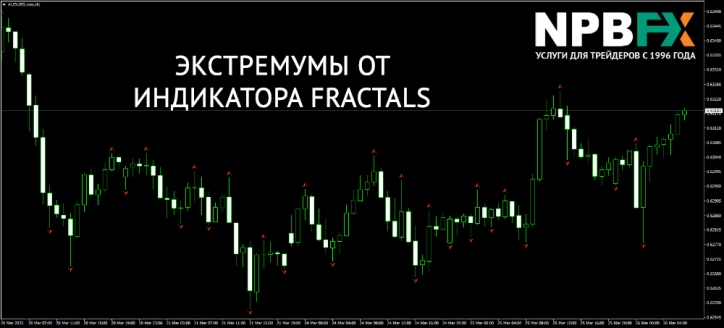
In the first case, the MetaTrader 4 built-in Fractals indicator is used, which can be found under "Insert" - "Indicators" - "Bill Williams" - "Fractals." The system will prompt you to select the indicator's color and then automatically add it to the chart. It looks like this. As you can see, there are a lot of symbols.
For those who prefer to work with more precise and long-term extremes, the ZigZag indicator is the best choice. It's also built into the MT4 terminal. Adding it to the chart of any instrument yields the following results.
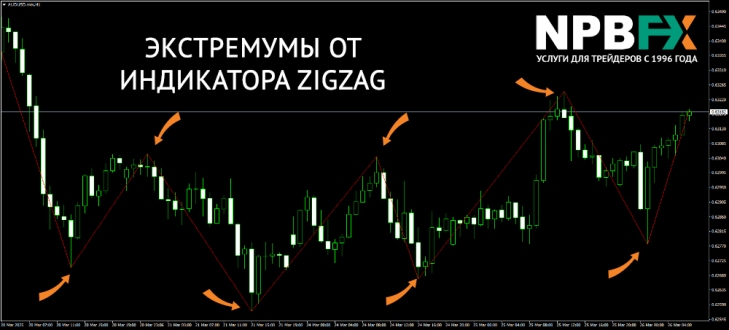
Clearly defined peaks and troughs are the most extreme values. The indicator ignores smaller market ups and downs and marks the areas worth paying attention to with a solid zigzag line. It's worth noting that the indicator's straight lines continue to shift until an angle is formed. Once an angle appears on the chart, the line remains in place and doesn't redraw.
Photo 2
NPBFX Broker : Access to Financial Markets Since 1996
To fully implement trading strategies, a broker offering favorable and comfortable conditions is essential. NPBFX is precisely this – its unique level of security and impeccable reputation have been proven for decades (since 1996). The broker serves clients on an A-book basis, eliminating conflicts of interest. Furthermore, the company is a member of The Financial Commission, guaranteeing deposit insurance for clients and payouts of up to €20,000 in the event of a dispute.
Flexible trading conditions will suit any trading strategy. Variable leverage (up to 1:1000), five trading markets (FX, cryptocurrencies, commodities, jewelry, and stocks), and a minimum deposit of just $10 make trading accessible to everyone. Furthermore, NPBFX has no restrictions on trading strategies—you can use any, including scalping or robots. You can open an account via the link on the broker's official website.

