The Fibonacci Spiral: The Magic of Numbers in Market Forecasting
The Fibonacci spiral is a truly mysterious tool for a Forex trader. In fact, when it comes to the Fibonacci sequence and various tools based on it, popular tools include arcs, levels, and the Fibonacci fan.
All of the above-mentioned tools have a history of successful use in technical market analysis, as well as specific training manuals for their use.
What's the point of being overly specific, as all of these tools are available in all trading terminals we know.
However, despite the popularity of all these tools,
the Fibonacci spiral is an exception, as it's practically unused, and no successful trader has written a practical training manual on it.
The origins of the Fibonacci numbers date back to the 12th century, and the discoverer of this sequence was Leonardo Fibonacci, the son of a wealthy merchant. Fibonacci once faced a challenging problem: determining how many rabbits a pair could breed in one year under confinement.
Through simple calculations, Leonardo discovered a sequence of numbers in which each new value was the sum of the two preceding ones. Moreover, if the ratio of two adjacent numbers in the sequence was taken, it approached or equaled 1.618.
Having seen such a simple pattern, Fibonacci began to actively study various literature and it turned out that such a ratio is found not only in the problem he was considering, but also in many objects of living nature, as well as space.
The magic of numbers and ratios haunted many scientists of the time, but an example of a perfect Fibonacci figure was the spiral discovered while studying the shell of a snail. The shape of the snail's shell itself became the basis for constructing the Fibonacci spiral.
Fibonacci spiral in MT4. Installation
As we've already mentioned, the Fibonacci spiral isn't included by default in any Forex trading terminal, so to build it, you need to install a custom indicator directly into the MT4 trading terminal.
After downloading the indicator at the end of this article, place it in the appropriate folder in your terminal's data directory. To access the data directory, launch your trading terminal and open the File menu. You'll see a list of options, including opening the "Data Directory.".
After opening the data folder, find the "indicators" folder and drop the previously downloaded indicator into it. Then, close the data folder and update the platform. After restarting the trading terminal, the FX5 FiboSpiral indicator will appear in the list of custom indicators.
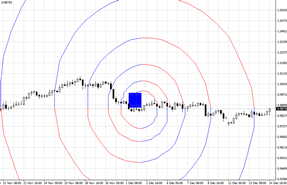
To display the Fibonacci spiral on a chart, simply drag the indicator onto any currency pair of your choice. You'll end up with a chart like this:

Correct Construction. Practical Application.
Unfortunately, you won't find any helpful instructions online on how to properly plot the spiral. However, it's safe to say that the indicator plots it incorrectly, as it lacks any predictive effect on the chart.
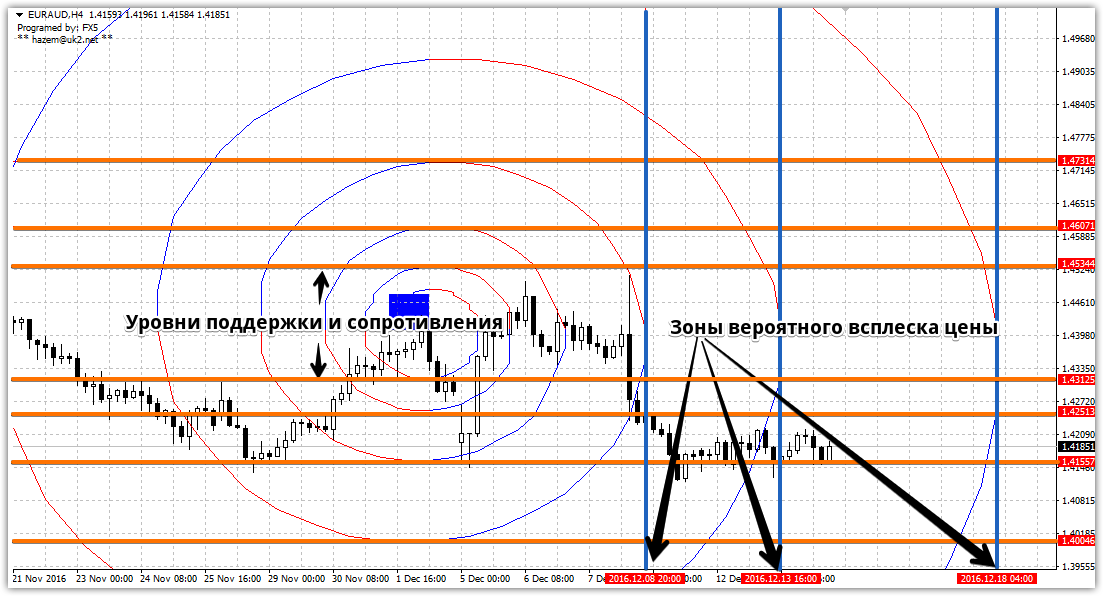
To properly plot the spiral, drag the blue square and stretch it between the points of the first or third Elliott wave. After you stretch the central square, the spiral will automatically reshape.
In practical terms, the spiral turns are considered strong support and resistance levels, as well as time zones that can be used to identify probable price spikes.
To mark support and resistance levels, draw horizontal lines at the points where the spiral meets. Reversal points and dates are marked on the chart by drawing horizontal lines that touch the rim of the spiral. Example:
Once you've marked all support and resistance levels, trading boils down to opening positions based on their breakouts or rebounds (depending on the market situation you're observing). In conclusion, I'd like to point out that the Fibonacci spiral may seem like a rather complex technical analysis tool at first glance . However, this perception stems not from the spiral's technical properties, but from a lack of practical information on its application. Download the required indicator.

