How to read technical analysis charts.
The chart in a trader's terminal is the primary focus of technical analysis. Even without using specialized indicators, you can  learn quite a lot simply by reading a currency pair's chart.
Most of the indicators needed for technical analysis are readily apparent, and the chart provides insight not only into the current market situation but also into what was happening with a given currency pair a month or a year ago.
What information does a currency pair chart contain?
• Currency pair name - in the upper right corner of the chart.
• Time frame - the time interval which one candle is equal to, for example on M1, the formation of one candle takes 1 minute.
• Current quote - the price at which you will buy or sell the currency pair.
• Information on the candle or bar - opening time, maximum price, minimum price, closing time.
How to read forex charts correctly?
First of all, you should take into account that if you open H1, this does not mean that the screen contains information only about the price movement during the hour. Such a time interval corresponds to only one candle.
At the minimum scale, this chart displays a trend for approximately two weeks. Therefore, all indicators will correspond to a two-week time interval.
In order to get information specifically for the current hour, you should switch to M1 and adjust the chart using the scale.
You can, of course, simply select the required time interval, but the described approach is more convenient.
The main indicators you can get from a currency pair chart are:
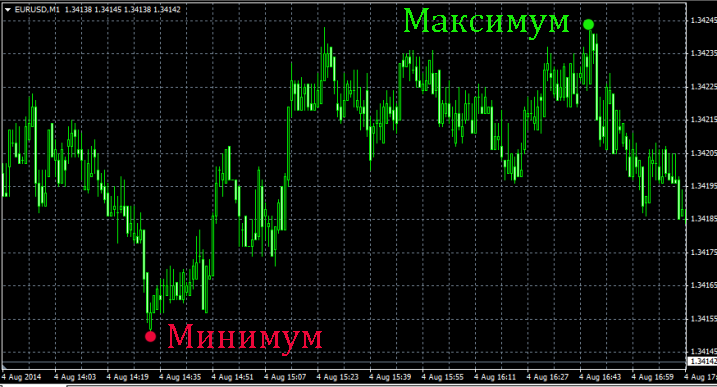
1. Price highs and lows – by selecting the desired time period, you can find the high and low prices for that time frame. To do this, simply select the highest and lowest points of the trend.
If you want to find out the price for a previous time period, it's even easier. For example, select the D1 time frame and hover your mouse over the desired candlestick. A tooltip will display all the necessary price information for the day.
What do these indicators tell us? If the market is currently trending upward, but the price is still quite far from the high on a given time frame, then there's a high probability that the current trend will continue.
2. Trend direction – often, by looking at a currency pair's chart, you can easily determine the main trend direction.
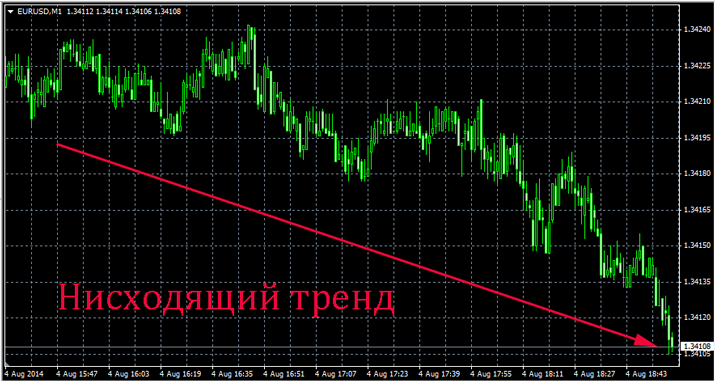
It's important to remember that you'll only see price movement within this timeframe, and to get a full picture, it's always a good idea to look at adjacent timeframes.
3. Market volatility - or the range of price movements, defined as the distance between the highest and lowest prices.
4. Price movement speed - for example, per day, the price opened at 1.3545 and ended at 1.3665, meaning the price moved 120 points in 24 hours.
5. Opening and closing prices - that is, the opening and closing prices of the selected timeframe.
Why is this necessary? This allows us to measure the potential of a currency pair and at least roughly estimate the profit we can expect from this instrument.
A currency pair chart is an excellent source of information for visual market analysis; the correct use of a few simple parameters allows you to form an understanding of the trend.

