Forex trend line
The trend line is one of the oldest and most effective tools of technical analysis, dating back to the first definition of a trend by Charles Dow.
Before we move on to the trend lines themselves, I suggest recalling what a trend is and what types of it are identified by technical market analysis.
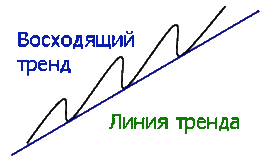
According to Dow, trends can be upward, downward, or horizontal. An upward trend is a succession of rising peaks, with each new peak and trough being higher than the previous one.
A downward trend is characterized by the gradual emergence of downward peaks, with each new peak forming below the previous one.
A horizontal trend, also known as a flat, is characterized by the fact that all new peaks and troughs are in the same vertical plane and practically at the same level.
Drawing trend lines
Since trend lines are the most popular technical analysis tool, there are a myriad of ways and methods to draw them. It's sometimes believed that there's simply no clear definition of how to draw a trend line, as it all depends on the trader's understanding of the pivot points rather than a clear, logical algorithm for drawing them.
However, if we boil it all down, we can identify one simple rule: at least two reference points are required to draw trend lines. For an uptrend, the line is drawn using two minimum price reference points, while for a downtrend, it's drawn using two maximum price reference points.
Victor Sparandeo has more clearly defined the rules for constructing trend lines, and you can learn more about his method in an article called The Sparandeo Method. Briefly, for an uptrend, Sparandeo suggests constructing a trend line based on the lowest point and the second point preceding the highest price high.
For a downtrend, a line is drawn through the high and the second point preceding the highest low. An example of a trend line is shown in the image below:
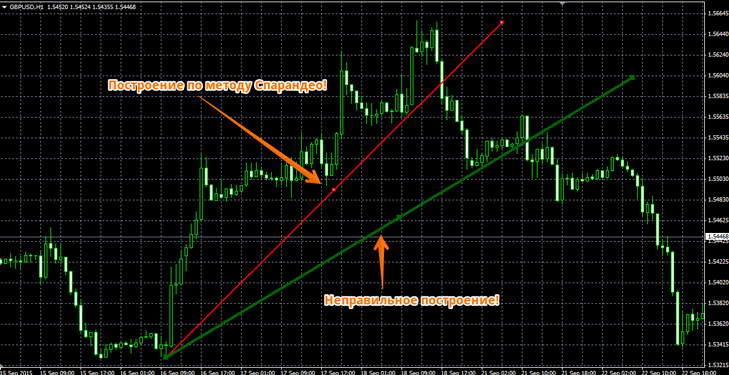
In the example, you can see two types of trend line construction, however, if you were to build it according to Sparandeo, you would have seen a trend reversal much earlier, unlike the other option, when you would have considered a broken trend to still be active.
Therefore, in terms of construction, the Sparandeo method is the most straightforward and is what I recommend for all beginners. Another question that many people have is whether to use shadows or opening and closing prices. There's no clear answer in this case, but shadows are often more convenient. However, a trend line drawn using the candlestick body will also be accurate.
Trading signals when working with trend lines
Now that we've learned how to draw trend lines, let's look at the trading signals they provide. While they're excellent at signaling trend reversals, the vast majority of traders use them as support and resistance lines, entering positions in the direction of the trend when they bounce off the line. For a better understanding, consider the example below:

Trend lines are used to construct a technical analysis tool called a channel. To do this, in addition to the standard trend line, a second line must be drawn using the same principle, but based on the minimum or maximum points, depending on the trend (upward or downward).
Thus, we plot the support and resistance lines that form the channel boundaries on the chart and trade on a rebound from them. For clarity, see the image below:
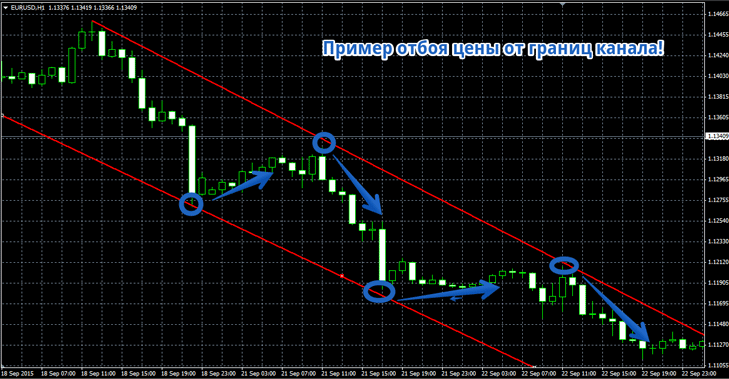
When trading in a channel, you should understand that trades you open against the main trend direction are likely to have a small profit, as you're trading counter-trend, which can often be fraught with consequences. However, this approach allows you to profit from even the slightest price fluctuations.
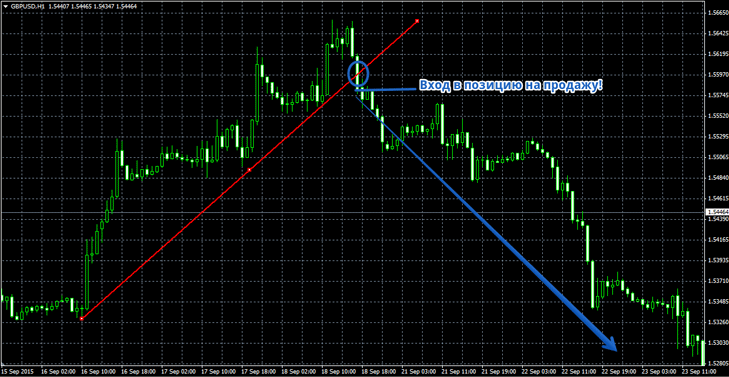
Trend lines also help you recognize trend changes in a timely manner and, at a minimum, close existing positions that were following the trend, as well as enter a position following a newly formed trend. A position is entered when the trend line is broken. For a full understanding, I suggest looking at the image below:
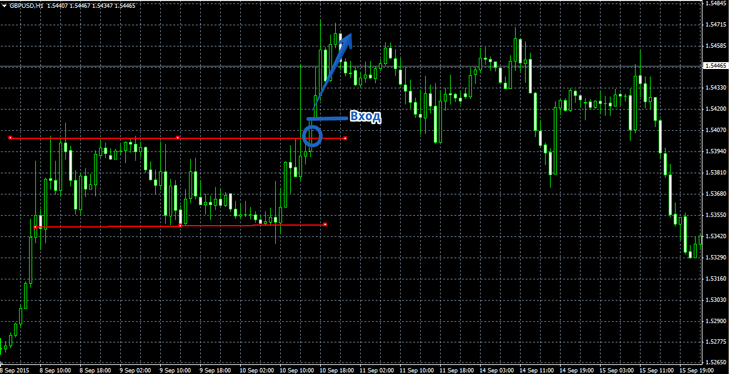
Trend lines drawn for horizontal markets, or in flat trading jargon, are called levels. These lines act as support and resistance, and are constructed using two points for each line. A breakout of one of the lines is the signal to enter a position. An example is shown in the image below:
Trend lines are one of the oldest technical analysis tools, but despite their age, when used correctly, they can lead to quite profitable trading strategies. The variety of their applications, as well as the number of trading signals they provide, will keep even the most active traders entertained.

