Gann's Tools
Gann is one of the most legendary traders in the history of trading. In a short period  of time, he amassed a fortune of $50 million, and you can always see his portrait when you enter the stock exchange floor.
In addition to his phenomenal success, Gann went down in history for making a significant contribution to the development of technical analysis, raising it to a new level and introducing new approaches to working with financial markets.
The most interesting thing is that Gann left us with a bunch of different tools that he still uses in technical market analysis, but, unfortunately, due to the difficulty of writing books about them, no one really understands which of the approaches actually helped him make such a fortune.
There is even an opinion among traders that Gann is not telling the whole story and has not revealed the main secrets of using his tools.
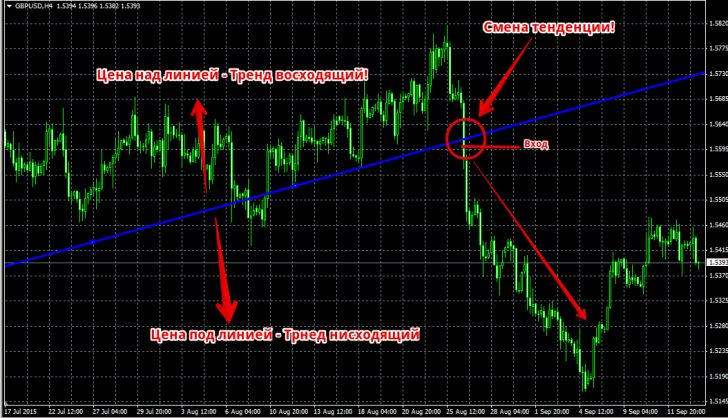
The Gann line is a line drawn at a 45-degree angle. The tool's creator claimed that a line drawn at this angle is a trend line. If the price is above it, the market is bullish, and if the price is below it, the market is bearish.
To use the Gann Line, go to the Insert menu, open the Gann category, and select the Gann Line tool. To draw it, select two points, after which the line will appear automatically. When working with the tool, you'll notice that the Gann Line acts as a strong support or resistance level, so many traders trade on rebounds from these levels.
Gann believed that if the price breaks this line, it indicates a change in market trend, and therefore a trend reversal. Therefore, to enter a sell position in a bullish market, we wait for the line to be broken downwards, while in a bearish market, the signal to enter a buy position is a breakout of the line from below. You can see an example in the image below:
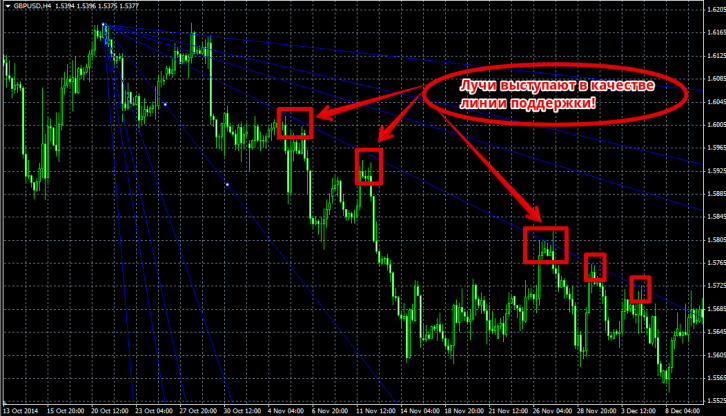
The second Gann tool built into the MT4 trading terminal by default is the Gann Fan. The Fan is a set of lines positioned at different angles, resembling a fan when unfolded. The Fan consists of nine rays, the most important of which is the central ray, angled at 45 degrees.
Gann argued that all nine rays, depending on the price movement, can act as both support and resistance lines, so if the price breaks through at least one of the rays, it immediately rushes to another, which is our goal when entering a position.
As I mentioned earlier, the central ray is the main one and shows the trend direction. Therefore, if the price breaks through the ray in one direction, it's an excellent signal of a trend reversal and, therefore, a good entry signal. The fan is constructed using two points, but it's important to ensure that the central line maintains a 45-degree angle. You can see an example of a Gann Fan in the image below:
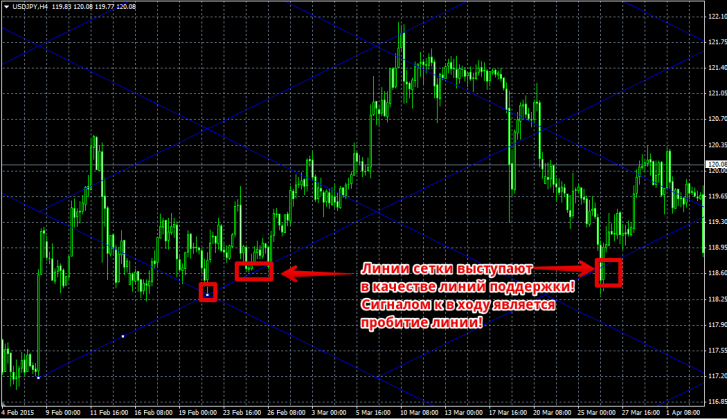
The third and probably most widely used of Gann's tools is the Gann Grid. The Gann Grid consists of lines at 45-degree angles, which form a grid of lines. According to Gann, these lines represent trend lines, so if the price is above an ascending line, the trend is considered bullish, and if the price is below a descending line, the trend is considered bearish.
If one of the lines is broken, it signals a trend reversal, meaning a change in direction. Using a grid, you can clearly see where the price will begin to consolidate after the breakout, as well as a possible target after the breakout. The grid is applied to the chart using two points, and the cell size is adjusted manually. You can see an example of the grid in the image below:
In conclusion, I would like to note that Gann's tools are widely popular among traders, however, due to the fact that Gann did not leave his own trading strategy, all instructions were written by his followers, which does not give us a 100% guarantee of the correct application of his tools.

