Support and resistance lines.
The Forex market trend follows its own law: the price sometimes rises to a certain point, then falls. This creates so-called highs and lows, which characterize peaks and troughs on the price chart.
These points correspond to a specific time period, and each timeframe has its own unique and unique characteristics.
These highs and lows are used as the basis for constructing support and resistance lines, which require at least two points on the currency pair's chart.
Building a support line.
A support line marks the minimum price level reached on a specific timeframe. When approaching it, the price reverses and begins to rise. This line effectively serves as an excellent benchmark for opening long positions on Forex.
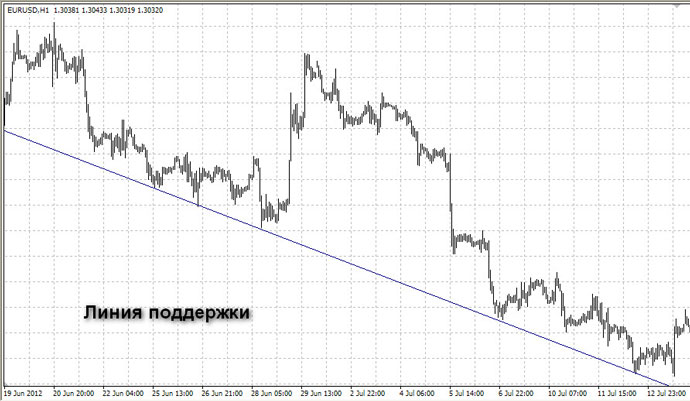
To draw a support line, follow these simple steps:
1. Select a time frame.
2. Identify several price lows within it. The points should be significant and not represent false breakouts.
3. Connect the points with a straight line.
The line is drawn using the trader's terminal tools or a support and resistance line indicator. The latter option is preferable, as you won't have to repeat the entire process if the price changes.
Plotting a resistance line.
This line characterizes the upper price limit of the trend, upon reaching which the price retraces downwards. It is, so to speak, a price ceiling, the value of which is constantly changing. However, don't assume that the resistance line is always horizontal; more often, it points in the direction of the existing trend.
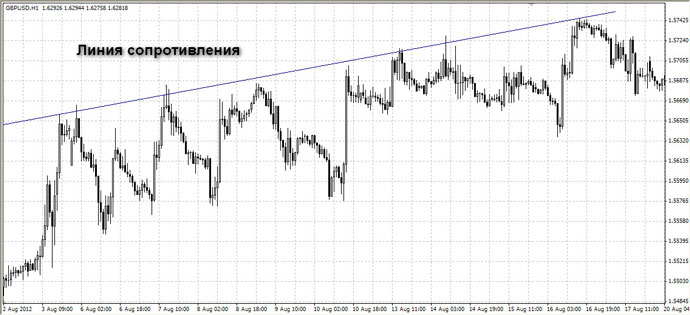
The construction of a resistance line is carried out in the same way as a support line, only the maximums of a given time frame are used as base points.
Trade.
Once both lines are plotted on a currency pair chart, they form a price channel that perfectly characterizes the current trend direction, while the channel width indicates its dynamics. The channel's direction can be used to determine whether the prevailing trend is an uptrend or a downtrend.
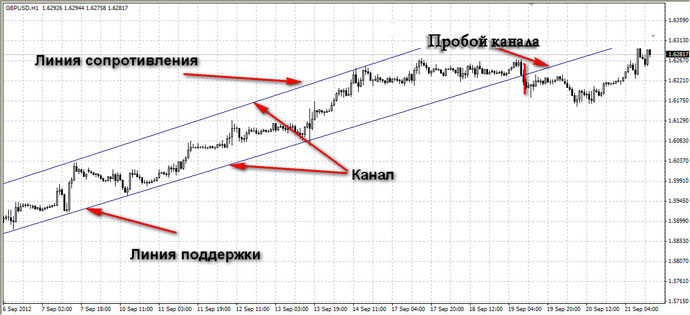
Trading in a price channel is quite simple, one of the variants of such a trading strategy is described in detail in the article "Scalping in a Price Channel", but the strategy can be successfully used with other trading options.
Usually, the following events serve as signals for buying transactions:
• The price has made a reversal at the support line and has started to rise.
• The price has broken through the resistance level and has moved several tens of points.
Short transactions are opened when the opposite conditions appear:
• The price has reversed at the resistance line and has started to move downwards.
• The support line has been broken and the rate has further fallen.
It should be remembered that the direction of transactions should correspond to the general direction of the trend, except in cases where a forex breakout.

