What is a reversal candle and how to spot candlestick patterns?
Japanese candlesticks are one of the most popular charting methods. They allow traders to assess the market situation, conduct analysis, and determine their next steps.
This is why without the ability to “read” candlesticks it is very difficult to succeed in Forex.
Today, with the support of the dynamic broker NPBFX, we'll explore what a reversal candle is and how to spot reversal candlestick patterns on charts.
Reversal candles are candles that trigger a market trend reversal. To be absolutely certain that a candle is a reversal candle, you need to make sure it follows an uptrend or a downtrend.
However, a single candlestick cannot signal a reversal on its own, as it is not a pattern. Only after receiving confirmation on the chart can the resulting figure be assessed as a pattern and, therefore, a signal.
Before we look at the different reversal candlestick patterns that exist in the market, let's look at a specific candlestick type often called an "indecision candle." These are doji candlesticks, some of the most visually distinctive candlestick types. They have disproportionately large shadows. Doji candlesticks form when the opening and closing prices are close to each other (or exactly the same). They can become reversal doji candlesticks if they are adjacent to each other and have large bodies.
For example, if a doji candle is short but has a long shadow underneath, it indicates a bearish trade, where demand has exceeded supply, which may indicate an imminent reversal. If the long shadow is above the short candle, the trend is the opposite.
Reversal candlestick patterns
The number of different patterns that can be used to predict future price movement exceeds several dozen. Therefore, it's impossible to cover everything at once in a short period of time. In this article, we'll look at several of the most popular combinations that indicate an imminent trend reversal on the chart.
of absorption :
- The bullish engulfing pattern is considered one of the most common reversal patterns in the market. It looks like this: first, there's a sharp decline, the last candlestick of which is completely covered by a lighter candlestick. This indicates that the bulls have seized the initiative, engulfing the sellers.
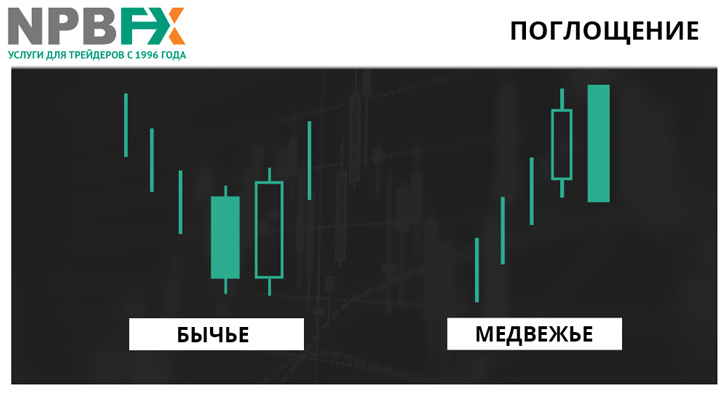
Please note! When this pattern forms, the closing price of the final falling candlestick and the opening price of the rising candlestick may coincide. However, the closing price of the bullish candlestick will inevitably be higher than the opening price of the falling candlestick. Ideally, the body of the rising candlestick overlaps the range of the bearish candlestick.
- Bearish Engulfing. This is the opposite of a bullish engulfing pattern. This means it works in reverse, emerging during a previously uptrend. Otherwise, the rules for forming this pattern are exactly the same.
- Lost Baby. Remember the discussion about doji candlesticks above? This pattern is one example in which this type of candlestick plays a key role. The pattern itself is very rare, yet it offers a fairly strong signal. It usually marks the end of a trend and is most common on relatively high timeframes, such as the daily.
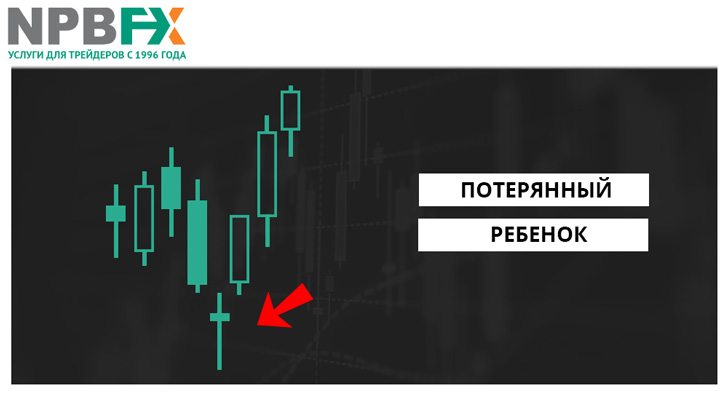
On the chart, a so-called gap appears after the bearish candle, after which a doji with a long shadow is formed, and immediately after it, a bullish candle with an upward gap.
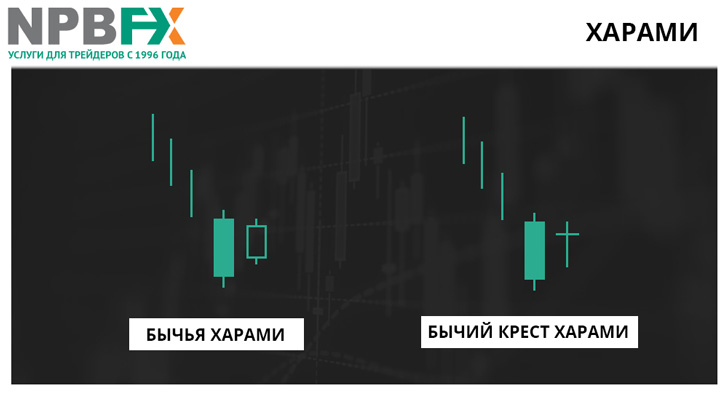
- Harami , or "pregnant candle," is a candlestick pattern consisting of two components. One candle is completely within the range of the first (see the image below), but it is colored differently. If the first candle is bearish, the smaller one is bullish, and vice versa. This pattern typically forms after a sharp decline and rise on the chart.
Please note! A "nested" candlestick, that is, a candlestick within the range of the previous one, can also be a doji. In this case, the pattern is called a bullish/bearish harami cross.
So what's the point of this pattern? At some point, the market stops, as if hesitating. Moreover, this pattern is quite rare, which is why traders value it so highly.
- Hammer/Hanging Man. This type of candlestick—with a very small body and a long shadow (which can be upper or lower)—is particularly prized by traders. The difference in names is explained by the trend. When forming a bullish candlestick, the pattern is called a "hammer," while when forming a bearish candlestick, it's called a "hanging man."
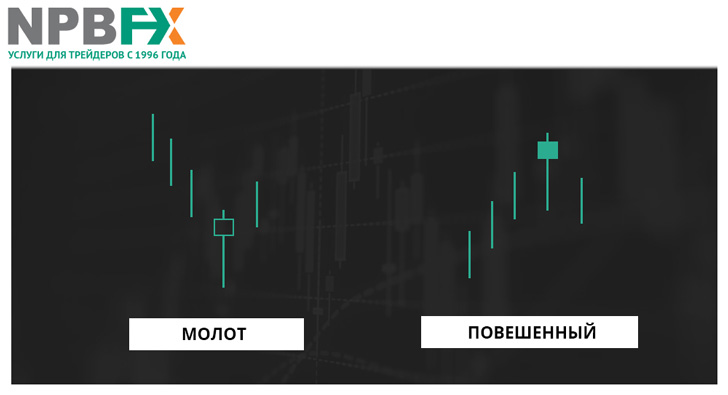
Please note! The appearance of such patterns in itself only provides a preliminary indication of a possible further market reversal. The real signal is a breakout of the high for a hammer, or the low for a hanging man.
- A piercing light, a dark curtain. This pattern has relatively weak signals, but it still deserves traders' attention. Such patterns indicate that forces have temporarily "shifted" to the opposite side of the trend.
In the case of a break in the clouds, the combination includes a candlestick with a long black body and a candlestick with a long white body, which opens below the low of the black candlestick and closes above its midpoint. The more the second body penetrates the first, the more likely a trend reversal is.
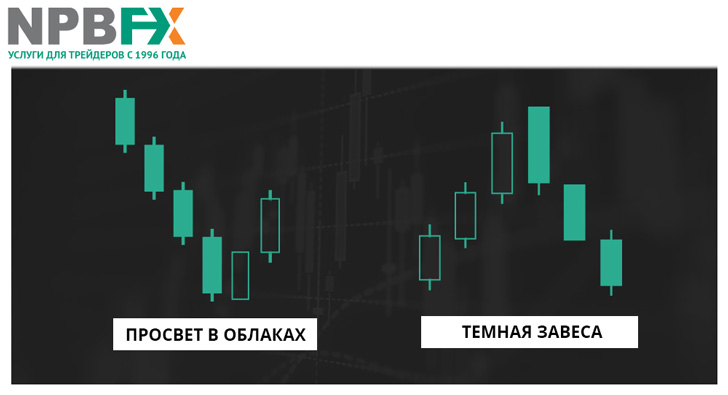
With a dark curtain, the combination of two candlesticks with long bodies remains, only the first is white and the second is dark. The black candlestick, opening below the low of the white candlestick, closes above its midpoint. In general, everything is traditionally the other way around.
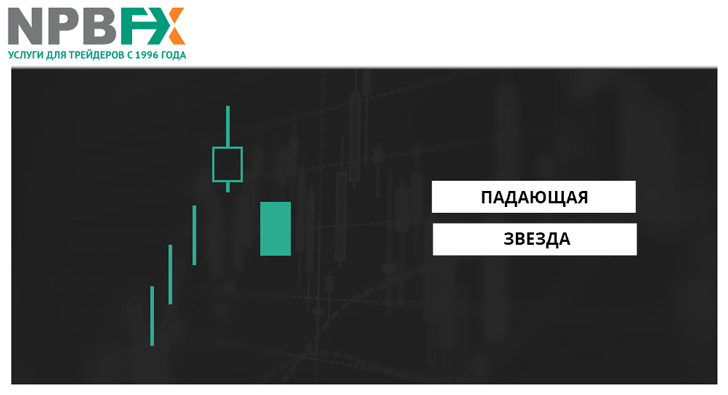
- Stars. These are candlesticks that have both a small body and a shadow. They form with a gap between the preceding and following candlesticks. For a reversal pattern to form, it's important to have a strong movement before the star appears and a candlestick opposite the trend that forms afterward. This pattern most often forms at the end of an uptrend.
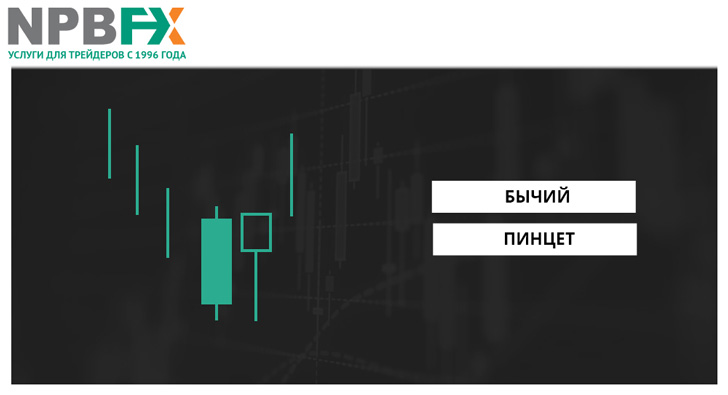
- Tweezers. This pattern is formed by a double bounce from the same level. The price can bounce twice during any trend. The pattern is used on all timeframes, including minute ones.
The presence of a reversal pattern on a chart doesn't necessarily mean a 100% trend reversal. It's entirely possible for the signal to be false, so it's always important to verify trading decisions before making them, backing them up with additional tools. NPBFX has developed a professional Analytical Portal specifically for this purpose. Access is free, and it contains a wealth of useful resources.
NPBFX Analytical Portal : Confidence in Trading Decisions
- Accurate trading signals. The portal has a dedicated section dedicated to trading signals, updated minute by minute, ensuring their maximum relevance. Furthermore, NPBFX's signals are particularly effective because they are based on a dozen popular and frequently used indicators. This positively impacts their accuracy, as one indicator can compensate for another.
- Regular analytical reviews. Full-fledged reviews of individual instruments and the market as a whole are published on the portal regularly, throughout the day on weekdays. Each review contains strictly to-the-point, no-nonsense information, as well as clear charts and trading recommendations. For convenience, a sophisticated filtering system allows you to select specific instruments and receive analytics only for them. This section works well for market analysis in conjunction with the economic calendar, which is also available on the portal.
- A selection of trading strategies. The portal's training offers information for both beginner and experienced traders. For example, it offers a comprehensive collection of over 60 trading strategies. You can find something to suit any taste—for example, filtering trading strategies by the specific indicator they use or by timeframe.
These aren't all the useful features offered by the NPBFX portal. You can learn more about them on the portal itself immediately after registering on the broker's website. Please note that access is completely free; there are no additional fees.
NPBFX Broker : Comfortable Terms and Deposit Insurance
The history of NPBFX can be roughly divided into two stages. The banking period, from 1996 to 2016, was when JSC Nefteprombank served as the service provider, providing clients with market access. During this time, a stable foundation was established, based on a high level of reliability and security. The second stage, beginning in 2016, began with a rebranding, without which further development in step with the modern Forex market would have been difficult.
Immediately following its rebranding, NPBFX became a member of the Financial Commission, an independent international body tasked with resolving disputes between brokers and their clients. NPBFX's Category A membership guarantees deposit insurance for each client—at the commission's discretion, compensation of up to €20,000 can be paid.
- Access to five markets (over 130 instruments) from one account.
- STP/NDD technology.
- Bringing transactions to the interbank market.
- A variety of accounts: from standard to zero and swap-free.
- Unlimited number of accounts of any type.
- Trading starts from $10.
- There are no restrictions on the use of trading strategies. Working with advisors and robots, hedging, locking, and scalping are permitted and encouraged.
- A large number of promotions and bonus offers, an affiliate program with several levels.
- A regular demo account competition, "Battle of Traders," features monthly prize draws of $2,500 and the chance to win a new iPhone.
You can open an account and start trading candlestick patterns in just a few minutes: to register, follow the link to the official website of the recommended broker, NPBFX.

