Overbought indicator: buy or sell?
Technical analysis of financial markets includes two very important concepts: “overbought” and “oversold”.

They are used in forecasting absolutely all markets: currency, stock, commodity, precious metals, and the cryptocurrency market.
At first glance, these two market conditions seem very simple, but traders make many mistakes in interpreting them, which leads to losses.
Together with experts from the international broker NPBFX (NEFTEPROMBANKFX), we explored the essence of these two market conditions.
We will tell you everything from A to Z in order.
|
NPBFX (NEFTEPROMBANKFX) is an international STP/NDD broker founded in 1996. The company provides retail and institutional clients with direct access to Tier 1 interbank liquidity. NPBFX trading accounts allow trading in forex, stocks and global indices, precious metals, oil and gas, and cryptocurrencies. Each client is insured by the International Financial Commission for €20,000, making trading with NPBFX as secure as possible. |
To begin with, let us understand the essence of these two market states.
- A market situation where the price of a trading asset has risen sharply and market participants are anticipating a decline. This market is called overbought.
- A market situation where the value of an asset has fallen sharply and market participants are anticipating its rise. This is called an oversold market.
Important! When analyzing, it's important to keep in mind that the market condition stated applies to the timeframe you're analyzing. For example, on the H4 (four-hour) period, the market will be overbought, while on the W1 (weekly) period, it will be oversold.
This means that the H4 rally is merely a technical correction, and the underlying trend remains downward. However, such a price correction should not be ignored, as it could be the beginning of a reversal of the underlying trend.
How to determine overbought and oversold conditions in the market
Technical indicators are the best way to determine market conditions. In this article, we'll look at the most popular ones recommended by NPBFX broker specialists: the RSI and MACD oscillators, as well as DeMarker. These indicators are also interesting because they are leading indicators, meaning they can alert you to a market reversal in advance.
Timeframes are also important to consider. As we noted above, they influence the accuracy of market forecasting. Now, let's move on to the indicators themselves and examine each in more detail.
oscillator for determining overbought and oversold market conditions
The popularity of the RSI oscillating indicator among traders is due to its ease of interpretation. What makes the RSI unique is that it is a relative strength index (RSI), meaning that in addition to determining overbought and oversold market conditions, it can also determine trend strength and the likelihood of a trend reversal.
The oscillator itself requires no complex settings and consists of a field with a scale from 0 to 100, along which an RSI line of a specific period moves. Typically, an RSI with a period of 8 is set. See the figure below:
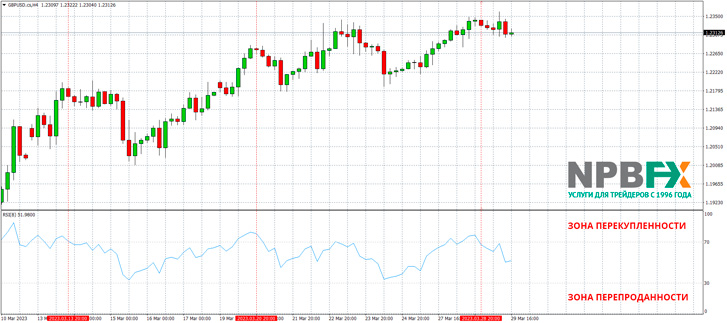
The oscillator field contains two zones: oversold (on a scale from 0 to 30) and overbought (on a scale from 70 to 100). When the price enters one of these zones, it indicates that the momentum will soon begin to fade. In the example above, we applied the RSI oscillator to the four-hour timeframe of the GBPUSD currency pair.
We also noted three candlesticks where the oscillator began to reverse direction in the overbought zone. This is a signal to open a sell trade on the British pound. Note that after further price declines, the oscillator never entered the oversold zone and, after some time, began to rise again. This situation indicates that the market is still in a strong uptrend, and all price declines are simply technical price corrections.
Oscillator for Determining Overbought and Oversold Market Conditions
Another indicator that helps determine whether a market is overbought or oversold is the legendary MACD. This oscillator is present on the price charts of at least every other trader. It allows for excellent forecasting of forex, stocks, and other markets.
The MACD oscillating indicator consists of a moving average and a histogram displayed as bars. The working area is divided by a zero mark into the positive and negative parts of the oscillator. See the figure below:
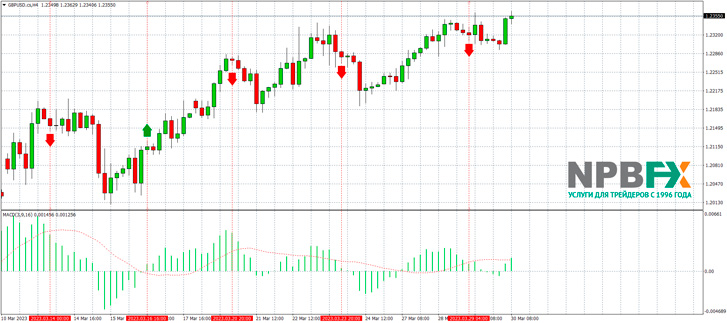
The MACD indicator not only allows you to determine whether the market is overbought and oversold, but also quite accurately signals upcoming price reversals.
A market is overbought when the moving average and histogram bars are in the positive region of the oscillator, while after a strong rally, the MACD bars begin to decline. This indicates that sellers are returning to the market. Focus on the maximum peak values of the MACD histogram, as lower "mountains" representing intermediate values may also be present in the positive region.
Oversold conditions can be identified by peak values of the MACD histogram in the negative zone of the oscillator. This is the same as determining overbought conditions, only in reverse.
As for reversal signals, they are defined as follows:
- Sell signal. The MACD histogram bars cross the MA from top to bottom in the positive zone of the oscillator. The moving average should also be above zero.
- Buy signal. The MACD histogram bars are decreasing and crossing the MA from below in the negative zone of the oscillator. The moving average is below zero at this time.
For clarity, we've highlighted these market reversal signals on the four-hour GBPUSD price chart above. Note that the MACD indicator, in most cases, signaled a reversal at the very beginning of the main price movement.
Oscillator for Determining Overbought and Oversold Market Conditions
The DeMarker technical indicator also belongs to the "leading" group. Its distinctive feature is that DeMarker signals predict an imminent change in the current market trend. It can be used on any timeframe, although its author originally created it for the daily period.
The classic DeMarker consists of an oscillator line with a period of 14 in the basic setting, as well as a scale from 0 to 1. The oscillator's working field is divided into zones: a value from 0 to 0.3 is the oversold zone, and a value from 0.7 to 1.0 is the overbought zone. However, for a more precise signal, traders narrow these zones, for example, from 0 to 0.1 (oversold) and from 0.9 to 1.0 (overbought).
Important! The DeMarker oscillator is not recommended for use in a flat market, so look for a trend chart for trading.
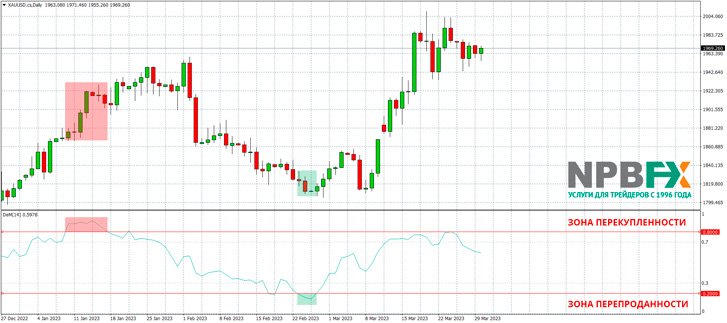
For our example, we used a daily timeframe, as intended by the oscillator's author, Thomas DeMarker, and the XAUUSD (gold/US dollar) trading pair. This further emphasizes that DeMarker can work in any market. Regarding the overbought and oversold zone settings, we chose something in between: 0-0.2 and 0.8-1.0.
As you can see, over three trading months, the chart showed only two situations where the market was overbought and oversold. However, as expected, the pair's price subsequently reversed. The trader made excellent profits from these two DeMarker signals.
Of course, a reversal doesn't always happen immediately. For example, after the oscillator line entered overbought territory, the price on the chart rose for over a week, followed by a price collapse. A more favorable situation developed when the oscillator line entered oversold territory. The market reversal occurred within a couple of days.
Conclusion
Overbought and oversold conditions are rare in the market. That's why traders need to be able to accurately identify them on the chart. This will allow them to predict reversals and enter or exit a trade at the very beginning of a move.
The indicators presented in this article represent only a fraction of what exists on the market. Each indicator deserves its own comprehensive article. We recommend studying them thoroughly to become fluent in overbought and oversold market conditions.

It's also important to remember that trading effectively in financial markets requires working with a reliable broker. Technical analysis and indicators are all well and good, but the broker processes trades and pays out profits just as well. We recommend NPBFX,. You won't have any problems with this broker!

