Wyckoff Chart in the Accumulation and Distribution Phase (Part Three)
This market phase is determined by the price behavior near the support line, which is based on the price lows of the given time frame.
At this point, the price slows down its downward movement, and then begins to move in an upward direction.
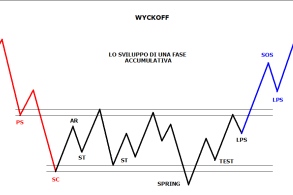
Events that occur during the accumulation phase
PS (Preliminary Support) shows the emergence of a significant number of buy trades after a long-term pullback, signaling that the downtrend may be coming to an end.
However, the volume of purchases is not yet sufficient to stop the price from falling further.
SC (Selling Climax – Peak Selling): This is the time when selling pressure reaches its peak.
Typically at this point the price closes above SC, reflecting the action of the main buying forces.
AR (automatic rally): Selling pressure has significantly diminished, and new buying force has pushed the price higher. The highest price of this rally is the upper limit of the TR trading range during the accumulation phase. The lower limit is SC.
ST (Secondary Test): This is the time when the market re-tests whether the downtrend has truly ended. When a bottom forms, meaning the price approaches the SC support area and moves upward, the volume and spread decrease significantly. After the SC, there may be one, two, or more STs.
Spring (jump forward): This is usually a trap set up by big forces to trick investors into believing the market will fall and sell stocks, which will help these big players buy at a very low price before the market rises again.
In the accumulation phase, Spring is not mandatory, i.e. it may not occur due to strong resistance of the SC support area.
Test: Major forces often retest supply during TRs or key bullish positions. If supply increases significantly during the test, the market is not ready for an uptrend. Once the test is successful, price will form a higher low and volume will decrease.
LPS (last support point): When the market begins to accumulate large volumes and price fluctuations, the LPS forces the price to move lower, as if building momentum in preparation for a strong attack and a breakout to a higher level. There may be more than one LPS point on an accumulation phase diagram.
SOS (sign of strength): As volume and price volatility increase, the price will break out of the TR range. SOS typically appears after a Spring, confirming previous price action.
BU (Backup): A term coined by Robert Evans, a leading teacher of the Wyckoff Method from the 1930s to the 1960s. According to him, BU can manifest itself in various forms, such as a rollback or a new TR at a higher level before the formation of an SOS.
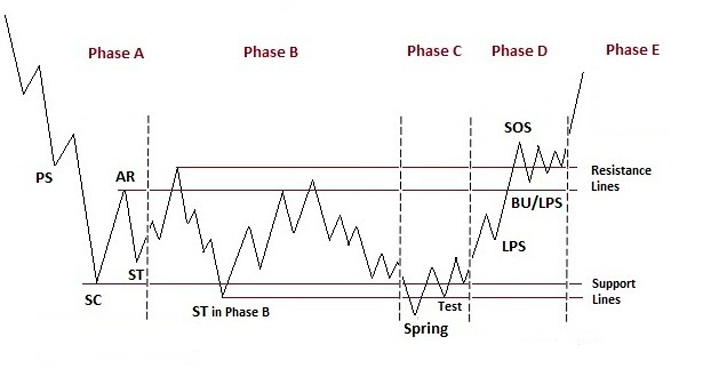
5 small stages in the cumulative scheme
Phase A: marks a slowdown in the previous downtrend. Here, supply still dominates demand. However, supply is weakening, as evidenced by the emergence of PS and SC.
Stage B: This is the "cause" creation stage in the Wyckoff method's law of cause and effect. At this stage, the market's major forces begin accumulating stocks at low prices to catch a new uptrend. Accumulation can take a long time.
Stage C: This stage involves a decisive test (Spring), which helps investors accurately determine whether the stock is poised for a price rise. In the Wyckoff method, a successful Spring gives investors the opportunity to trade with a high probability of success.
A low volume spring indicates that the stock is poised to rise in price, making it a good time for investors to place a buy order.
Phase D: marks the time when the price breaks through the TR zone resistance, beginning a new uptrend. During this period, pullbacks, buy-backs, or lose-loss orders typically occur before an SOS is formed, which is a good time to enter more potential buy orders.
Stage E: This is the stage when the price has most clearly broken through the TR, with demand exceeding supply. New, higher TRs may appear during this period, but usually with a shorter duration (the same re-accumulation phase mentioned above).
TRs This new move is seen as a stepping stone for the price to move higher.
Wyckoff diagram at the distribution stage
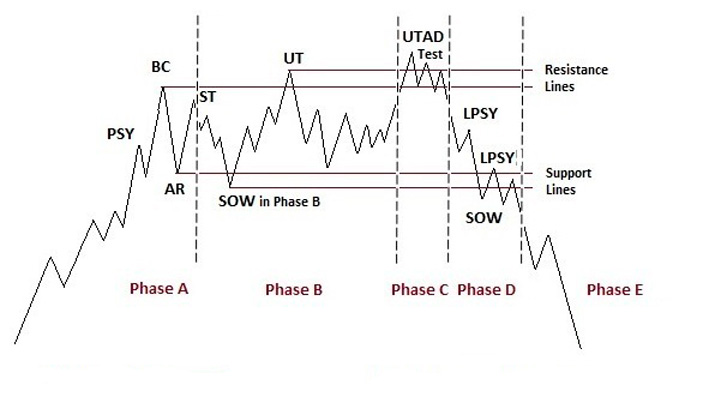
TR in the distribution period is also divided into 5 periods, the events that occur in these 5 periods are usually opposite to the accumulation phase.
You can perform the reverse analysis using the Wyckoff cumulative chart as above.
Continuation of the article, part four, "Composite Man" - https://time-forex.com/tehanaliz/kontseptsiya-sostavnoj-chelovek

