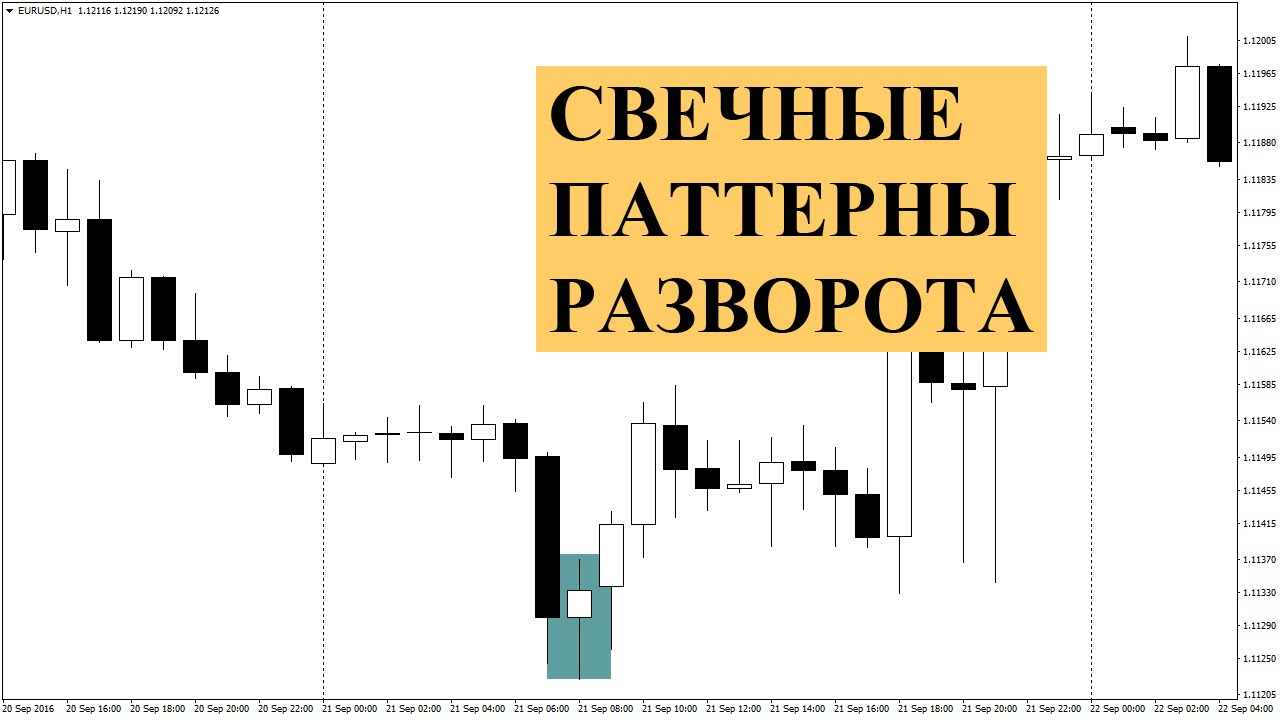
Price Action - Identifying Reversals and Corrections
There's a popular saying among traders: "Price is the most valuable indicator." Displaying charts as Japanese candlesticks allows every trader to experience the benefits of this analytical approach.

For example:
1. If the opening price is identical to the closing price of a graphical element, this indicates uncertainty among major trading participants.
2. An intense surge in quotes indicates a local correction is imminent, as the asset will most likely be overbought or oversold, which will trigger the opposite effect.
Subsequently, a trend may form in the direction of the price surge.
The Price Action candlestick analysis system is based on identified patterns in the behavior of currency pair charts.
Almost every novice trader has heard of Price Action at least once, but almost no one has tried to understand the intricacies of its application.
The complexity of candlestick analysis is deceptive. In fact, it's not only simple, but also profitable. You don't need to study every pattern.
 It only takes a few hours to examine just two of them, but they're the most effective: the "Rails" and "Pin Bar" patterns.
Review and practical application of the "Rails" pattern in Price Action
This is a strong signal indicating a trend reversal or the beginning of a deep correction.
Visually, the pattern can be identified by a characteristic appearance: the candlestick body completely covers the body of the previous price element. An important condition is that both candlesticks must be within the same range. A deviation of no more than 2-3 points is allowed.
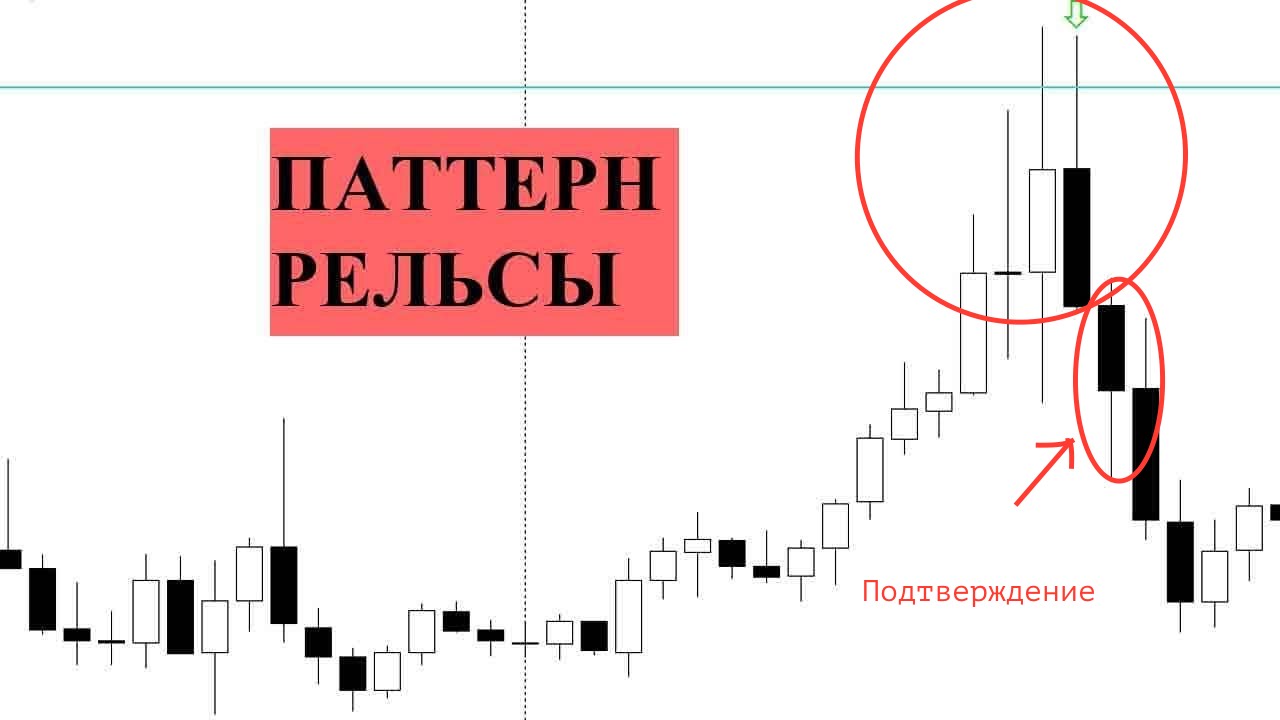 The image shows a completed "Rails" pattern. After the last candle of the pattern closes, it is important to wait for the final confirmation candle to form.
Only then can an order be opened. This pattern can be applied in practice both when trading Forex currency pairs and binary options (the expiration period is no more than 5 candles).
The higher the chart timeframe, the stronger the reversal signal. When working with the H4 timeframe, the potential profit is at least 50 pips in the event of a reversal and at least 30 pips in the event of a correction.
The "Pin Bar" pattern
is the easiest to identify and most effective reversal pattern. When working with H4 or D1 charts, a signal forecast based on this candle is executed 98% of the time. An important condition: the pin bar must be located in the area of the local level.
Visually, it appears as a candle with a small body and a long shadow. In some cases, the body may be absent altogether.
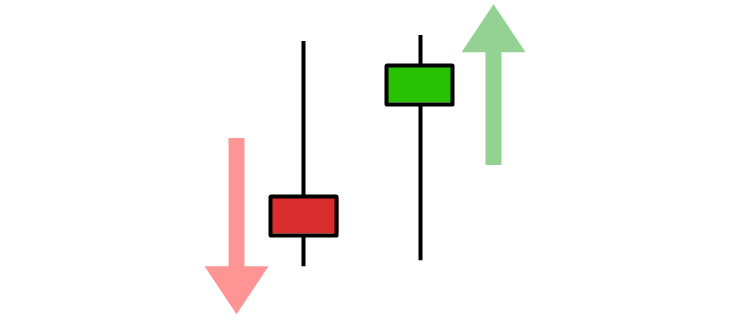 If the candlestick's shadow points upward, it indicates a possible downtrend; if it points downward, it indicates an uptrend.
Identifying these reversal patterns on a price chart is not difficult. It's important to note that formed reversal patterns on charts of M30 and below have no practical value, as they may be the result of market noise.
The optimal timeframe for searching for signals is H4.
Mastering and correctly applying Price Action reversal patterns is the foundation of profitable trading and the key to success in a trading career.
You can make a trader's work easier by using indicators:
Pattern Recognition - http://time-forex.com/indikators/pattern-recognition
Japanese Candlestick Indicator - http://time-forex.com/indikators/ind-ypon-svechey

