Japanese candlesticks.
The history of Japanese candlesticks dates back to the 17th century. It is believed that a Japanese rice trader was the first to use this tool in technical analysis, hence the name "Japanese candlestick."
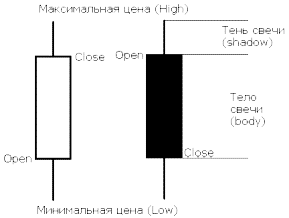
A Japanese candlestick is a graphical pattern that displays exchange rate fluctuations over a specific time period.
The main parameters that can be determined by studying a Japanese candlestick are:
• Opening price - displays the quote at the beginning of the time frame , for example, on H1 from 16:00 to 17:00 the opening price will be the quote at 16:00.
• Closing price – a parameter similar to the previous one, but already displaying the quote at the end of the time frame.
• Minimum price – the minimum price on a given time frame.
• Shadow - shows the difference between the opening (closing) price and the maximum (minimum).
• The body of the candle is a rectangle whose length displays the difference between the opening price and the closing price.
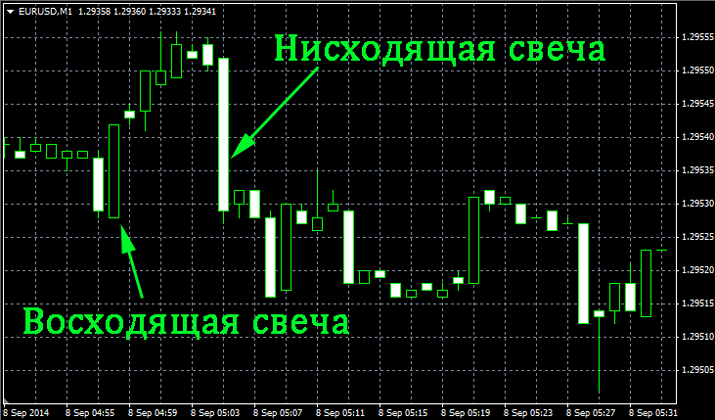
• Color - usually a filled candle indicates a downtrend, and a transparent one indicates an uptrend. In the MetaTrader 4 terminal, by default, a bullish candle is black, and a bearish candle is white. For convenience, you can change the color at your discretion.
Chart - Japanese candlesticks.
Switching to the display of the trend line as Japanese candlesticks in the trader's trading terminal occurs in the top panel or on the "Charts" tab.

As a Forex trend , it forms so-called candlestick patterns, which can indicate a continuation or reversal.
Candlestick patterns are most often used in graphical trend analysis. You'll find a more detailed description and photos of them in the following articles in the Japanese Candlesticks section.
Debates about the effectiveness of candlestick analysis continue to this day, but like any market analysis method, candlestick analysis has its supporters and detractors. You can only form your own opinion by using Japanese candlesticks in Forex trading.

