Evaluating the effectiveness of the most popular candlestick patterns
Every textbook on stock trading tells us that the price chart is the very first source of information a trader should look at, and only then apply any indicators and trading systems.

Indeed, many books are devoted to chart analysis, with candlestick analysis occupying a special hierarchy, since trading without the use of any trading tools is the highest level of skill that almost all beginning traders strive for.
Over time, traders have identified around three dozen different candlestick patterns, many of which actually work, while others have become ineffective as markets change.
However, there are the most popular candlestick patterns, of which there are no more than 5.
They became popular not because of their effectiveness, but only because they are very common and easy to spot.
But are popular candlestick patterns really that effective?
Can the simplest combinations, so common and easy to analyze even for beginners, really produce profitable trades? Unfortunately, you won't find answers to these questions anywhere, so we decided to collaborate with you to evaluate the effectiveness of the most popular candlestick patterns.
Of course, we won't be using complex calculation formulas, but rather we'll use history to find out which candlestick patterns actually work, what percentage of each combination works, and we'll draw conclusions about the potential trading efficiency using the most common candlestick patterns.
For our study, we selected a six-month period, namely from January 1, 2015, to June 30, 2015. Performance evaluation will be conducted only on the EUR/USD currency pair on an hourly time frame. Therefore, the results obtained reflect the actual situation only under these conditions, as changing the instrument or time period may yield completely different results.
Why EUR/USD and the hourly chart?
It's very simple: most traders use the hourly chart when analyzing Japanese candlesticks, and the EUR/USD because it's the most commonly used currency pair. We've established a certain constant for ourselves: if the price moves at least 15 pips after the signals appear, the pattern is effective; if not, we consider it unprofitable.
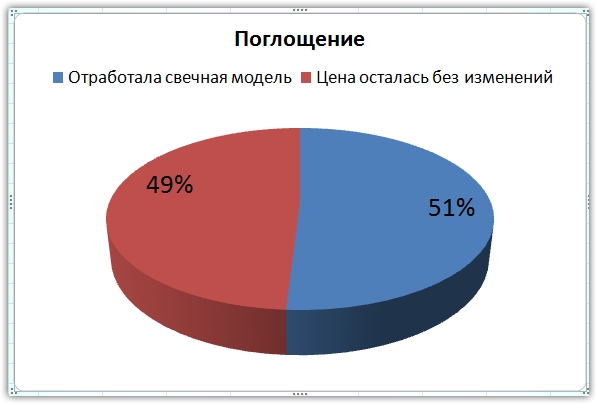
The first candlestick pattern we decided to examine is called "Engulfing." Briefly, it's a reversal pattern consisting of two candlesticks, with the second candlestick's body completely covering the first. During our six-month study, we recorded 53 trades, and this combination appeared so frequently that, when analyzing historical data, it seemed to be everywhere.
However, of all the signals that emerged, only 27 were successful, while in the remaining 26 cases, the trend continued. Therefore, the effectiveness of absorption is extremely weak, as in 49 percent of cases, the price remains unchanged, and in 51 percent of cases, the price breaks the 15-pip barrier.
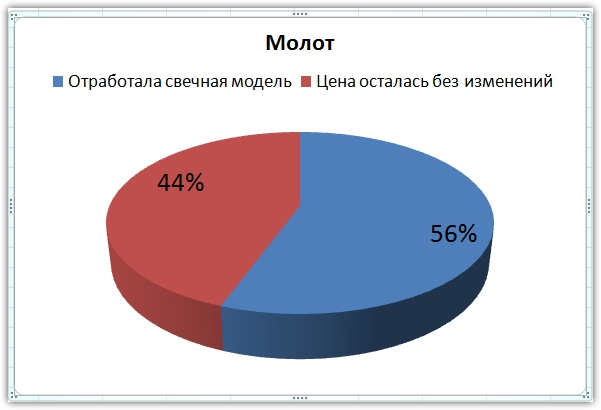
Another equally popular candlestick pattern, very easy to use and frequently encountered, is the Hammer. The Hammer is a reversal candlestick pattern and appears in bearish markets as a white candlestick with a long shadow and a small body, very reminiscent of a hammer.
The study found that 36 Hammer patterns were recorded over the course of six months, with 20 signals actually indicating a market reversal, while in the remaining 16 cases the price continued its trend.
Against the backdrop of the Engulfing, the hammer proved to be more effective, since in 56 percent of the recorded trades the price broke the 15-point barrier, and in 44 percent of cases the price continued its movement without any change in the direction of the trend.
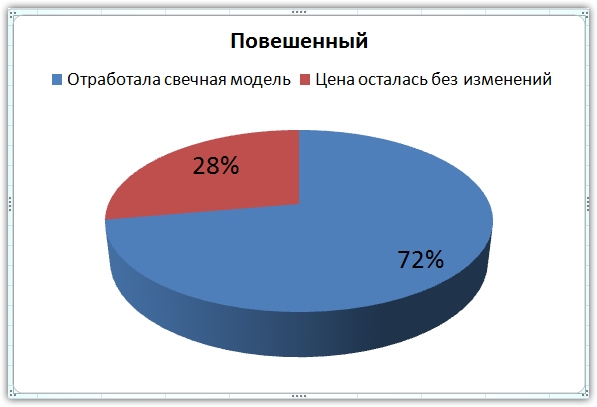
Another frequently used candlestick pattern is the "Hanging Man," which is practically analogous to the "Hammer" discussed above. It appears during a bullish trend as a candlestick with a long lower shadow, a weak body, and virtually no upper tail.
Unlike the Hammer, the pattern occurred extremely rarely over the course of six months, with only 18 recorded instances. In 13 of these, the market actually reversed, and in five, it continued its movement. The Hanged Man's effectiveness is significantly higher, as in 72 percent of trades, the price easily broke the 15-point barrier, and in 28 percent of cases, the trend continued without any change.
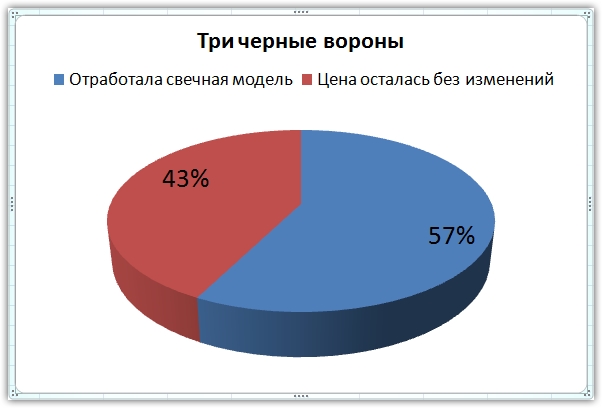
 The fourth candlestick pattern, which refers to trend continuation and is often used by beginners, is called the "Three Black Crows." It consists of three gradually descending bullish candles, which indicate the emergence of a new trend if they occur in a bull market or a continuation of the trend if they occur in a bear market.
Over the six-month period analyzed, the combination occurred 40 times. In 23 cases, the price moved in the direction of the signal, while in 17 cases, the price reversed or returned to the starting point. In 57 percent of cases, the candlestick combination worked out successfully, and only in 43 percent of cases did an undesirable reversal occur.
 At the end of the study, it became clear that the "Absorption" pattern is not very effective at this stage, since, taking into account the error in calculations, which can be 1-2 percent, then using this pattern you are playing a coin and nothing more.
The most effective pattern among those considered was the "Hanging Man," and its high success rate allows us to use it even in Binary Options, and even more so in the Forex market.

