Reversal candles - "Hammer and Hanged Man".
These two virtually indistinguishable Japanese candlesticks have long been recognized as harbingers of a reversal, although 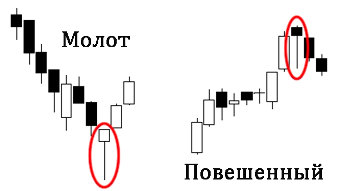 confirmation is required for a more accurate forecast.
Hammer and Hanging Man have a relatively small body and only a lower shadow, which indicates how much lower the low is than the closing or opening price, while the shadow is several times larger than the main body.
The upper shadow is completely absent, meaning the closing (opening) price is higher than the high for the given time frame.
The candle can be either ascending or descending, the direction of the short-term trend is of decisive importance.
A hammer appears when the market is in a downtrend. The candlestick itself is bullish. The events that form follow this pattern: initially, selling increases and the price drops sharply, but then the situation reverses and the closing price exceeds the opening price.
The next candlestick usually serves as confirmation of a trend reversal; it should open and close at a higher price, thus confirming the beginning of an uptrend.
A hanging man occurs during an uptrend; the candlestick indicates a downward price trend, as the closing price failed to rise above the opening price, and the timeframe.

