Trend continuation candles
All textbooks on stock trading, including their author, unanimously tell us  that trading should only be done in the direction of the trend, and never against it.
Indeed, trend trading is the most profitable activity, because if you follow the global market movement, you don't experience the psychological stress of a deposit drawdown, unlike someone who entered a position against it.
It won't take long for your trade profits to increase. It seems simple—you've found a trend and the right entry points—but in practice, we all face challenges.
The biggest problem with trend trading is that you don't know whether you are entering at the top and the final phase of the end of the trend or whether it will continue moving in the same direction.
This is an eternal problem that every trader faces, because you can never be 100% sure whether a trend will move in one direction or not.
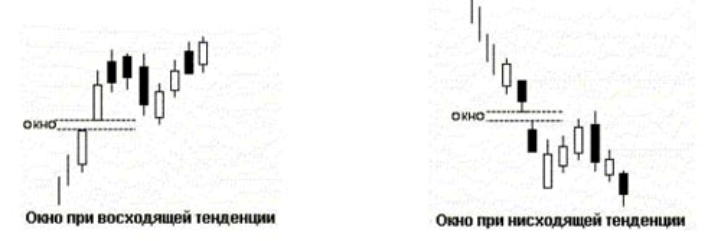
One of the most popular and well-known trend continuation patterns is the so-called "Window." The principle of the pattern is very simple: if you see two candlesticks with a price gap between them, this is an excellent signal that players have regained their strength and are once again pushing the trend to new price lows or highs. This phenomenon is also called a gap, but not the classic one you see on Monday at the market open, but one that occurs during active trading.
Many will probably say that the price always strives to close a gap and, as a rule, returns to the point where the gap began. While this is true, this rule applies primarily to the large gap that occurs on Monday at the market open. The "Window" candlestick pattern, however, is formed due to strong market pressure during the trading session, so the price immediately moves in the direction of the trend after the gap. You can see an example of a "Window" candlestick pattern in the image below:
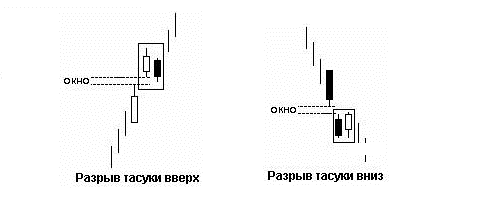
The second, equally popular trend continuation candlestick pattern is the "Tasuki Gap." These trend continuation candlesticks are a modified version of the previous "Window" pattern. This candlestick pattern exists for both bullish and bearish trend directions.
To determine if you're facing a Tasuki gap for a bullish trend, you should see a gap (pattern window) with two bullish candles between them. The second candle after the gap should be bearish, and if it doesn't close the gap, you can safely enter a buy trade. For a bearish trend, the Tasuki gap is the opposite: a gap forms between two black candles, and the second candle after the gap should be bullish.
If the gap isn't closed, you can safely enter a sell position in the direction of the main trend. The Tasuki Gap candlestick pattern is good because you enter on a minor pullback, rather than during the main movement. You can see an example of this candlestick pattern in the image below:
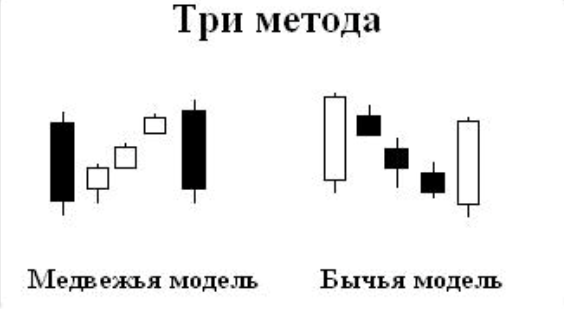
 The third candlestick pattern for trend continuation is the so-called "Three Methods." There are both bullish and bearish variations of this candlestick pattern. The bullish variation looks like this: a long bullish candlestick (white) appears, followed by a mini-pullback of three small bearish candlesticks, all of which together do not exceed the size of the first bullish candlestick.
If you see this combination, you can confidently enter a buy position. The bearish version of this candlestick pattern looks like this: a large bearish candlestick appears, followed by a mini-pullback of three small bullish candlesticks, the total size of which does not exceed the first bearish candlestick. If you see this pattern, you can confidently enter a sell position.
The unique feature of this candlestick pattern is that you enter a position after a pullback, thus achieving a decent profit without a significant drawdown. Please note that if the size of the three new candles exceeds the first, the pattern is considered invalid, and its signal should be ignored. You can see an example of the "Three Methods" candlestick pattern in the image below:
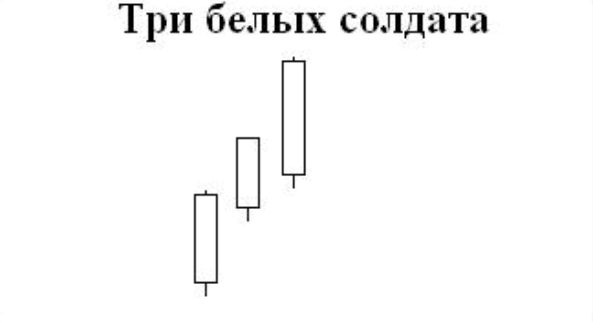
The fourth trend continuation candlestick pattern is symbolically called "Three Advancing White Soldiers." This pattern often occurs when the price has made a minor pullback in a bullish trend. Its essence is very simple: if three large bullish candlesticks appear, each closing higher than the previous one, this is a signal that the pullback is over and it's time to enter a buy position.
There's also a variation of the pattern for bear markets called the "Three Crows." It forms when a bear market pulls back and then three bearish candles appear, each closing higher than the other. If one of the candles in both variations closes lower than the previous one, you may be looking at a stalling pattern, which indicates weakness in the underlying trend.
Therefore, be careful when identifying the pattern. An example of the "Three Advancing White Soldiers" candlestick pattern can be seen in the image below:
In conclusion, I would like to say that Japanese candlestick patterns should become your main assistant in identifying certain market situations, since by analyzing them you can always enter the current trend and exit it before the price suddenly reverses against you.
You should understand that candlestick analysis works primarily well on stocks and, due to high volatility, is somewhat weaker on the forex market. If you use these models specifically on the forex market, I would recommend checking the signals against an indicator ( http://time-forex.com/indikators) or against the news background.

