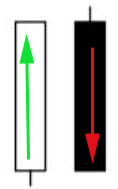
Marubozu closing candles.
This type of candlestick is one of the most common on candlestick charts. It can indicate either a trend continuation or a reversal, depending on its appearance and the combination in which it appears.
Marubozu means "cut," implying that the given timeframe closes at a price higher than the high or lower than the low, depending on the trend direction.
Marubozu come in two varieties: black and white.
Black Marubozu - appears during a downtrend and most often signals a trend continuation, as the candlestick's close is below the existing low. This candlestick is considered quite weak, and drawing conclusions based solely on its appearance is risky.
White Marubozu - unlike the black Marubozu, the white one is a stronger candlestick; when it appears, the daily high is below the closing price. This indicates that the existing uptrend is likely to continue.
If a Marubozu candlestick appears during an opposite trend, it likely indicates a high probability of a reversal.
Marubozu candlesticks come in different types, and depending on these, they characterize the trend . This article discusses closing Marubozu candlesticks.
If you use the MetaTrader 4 terminal, a bearish candlestick is white, and a bullish candlestick is black, meaning vice versa.

