Japanese candlesticks spinning tops.
Another type of candlestick that you can often see on technical analysis charts,  this candlestick received such a unique name due to its resemblance to a spinning top.
Spinning tops have a relatively short body and two shadows that are equal and longer than the body itself.
In appearance, they resemble the spinning top we've all seen since childhood, but their structure makes them easily visible on charts.
The candlestick's shape indicates a slowdown in price movement, as the price remained virtually unchanged between the opening and closing prices, despite some fluctuations during their formation.
The appearance of Spinning Tops should alert traders, as they sometimes herald a trend reversal or correction. These Japanese candlesticks also often seen during horizontal price movements (flats).
Therefore, if you have open trades at this point, you should prepare to close them. However, if you're about to open a new position, it's best to wait for further developments.
The example below clearly shows what happens after a Spinning Top candlestick appears on a currency pair chart.
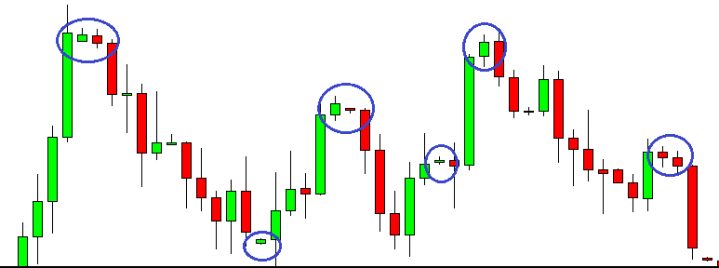
It is clear that there are exceptions to any rule, so we use a reversal indicator.

