Trend reversal indicator.
A fairly effective indicator that helps you spot a trend reversal in time, and close an existing position or, conversely, choose the best moment to 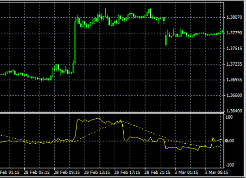 open a new order.
The trend reversal indicator uses a moving average when generating forecasts. Its operating principle is similar to the popular Moving Average, but it's a more advanced version.
Thanks to the changes, the indicator is now displayed in a separate window below the main currency pair chart, and its entire operation is based on three lines.
Download the trend reversal indicator.
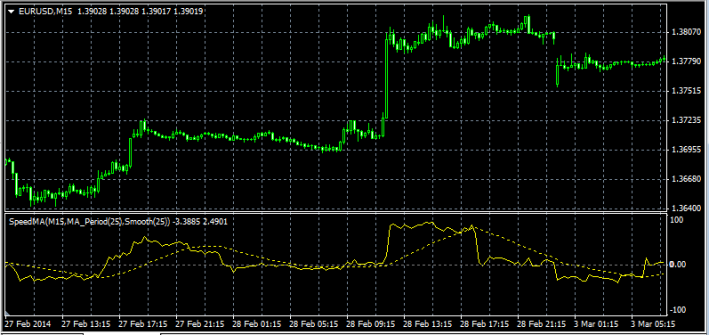
After installing the script, three lines will appear in a separate window. The first (axial) divides the movement field into a positive range from 0 to +100 and a negative range from 0 to -100. The other two lines (signal) are curves of the same color.
• The axial line strengthens or weakens the received signal, depending on which side of it the other two lines are on. In the positive range, there are buy signals, in the negative, there are sell signals.
• Signal lines give signals to enter the market, a new signal comes out after the lines cross:
A buy order is opened if the solid line crosses the dotted line in an upward direction, and all this happens in a positive range.
A sell order is opened if the solid line crosses the dotted line in a downward direction, it is desirable that the intersection point is in the negative range.
Since any signal could be the beginning of a trend reversal, don't forget about existing positions. It's best to close them when you receive information about a reversal against an open order.
Additional settings are located in the shared archive with the trend reversal indicator file.

