RSI index indicator
Another tool for finding the most successful entry points into the market, the RSI index indicator allows you to quickly and, most importantly, quite accurately analyze the prevailing trend in the Forex market.

The script works equally effectively on all currency pairs and any time frames, and is completely universal.
With its help, you can trade using almost any trading strategy, and the available settings allow you to adjust the script according to your needs.
The RSI index is also called the relative strength index; an indicator developed on its basis makes it possible to determine the occurrence of changes in the main trend of the price movement of a currency pair.
The basis of the work is the divergence of two moving averages, and the main signals are their intersection of the established price levels.
If desired, all settings can be left unchanged; even with them, the tool works quite accurately.

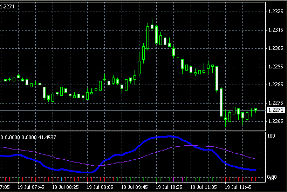
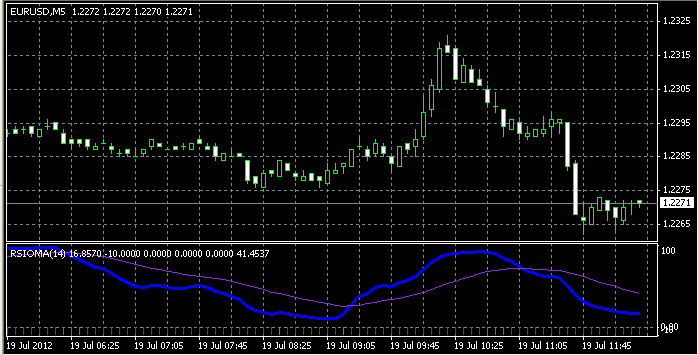
After carrying out all the necessary actions, the indicator window will appear below the chart of the currency pair, in it you will be able to observe two curved lines that move between two levels.
There is also a row of green and red bars at the bottom of the screen; they serve as an additional guide when a new trend arises.
Setting up the rsi index indicator.
RSIOMA – the period on the basis of which the analysis is carried out, is equal to 14 by default; if the speed of price movement increases, this indicator can be reduced.
RSIOMA_MODE – shows in which mode the indicator operates.
RSIOMA_PRICE – basic value of the price level.
Ma_RSIOMA – period indicator for calculating RSI
Ma_RSIOMA_MODE – mode.
Buy trigger – market overbought level.
Sell trigger – market oversold level.
In addition, there are several less important parameters; their settings can be left at default.
Strategy for using the indicator
The RSI index indicator makes it possible to receive signals for opening and closing orders; based on the data received, trading occurs as follows:
Buying – exiting the oversold zone and moving the thick blue line upward; it is better to make transactions not at the very beginning of the movement, but only after you are convinced that the price confirms the indicator readings.
Sell – the blue line begins its movement in a downward direction and leaves the overbought zone.
Also, by observing the indicator lines, we can conclude that the closer the blue line is to the top, the higher the likelihood of a downward trend, and vice versa, as it approaches the bottom, the greater the likelihood of an uptrend.
This rule can serve as an additional guideline when opening new positions or tracking already open positions.
If you wish, you can move significant levels at your discretion, thereby reducing or increasing the number of input signals. The more signals that occur during program operation, the higher the risk of errors.
