
ZUP indicator.
A complete tool that allows you to accurately determine trend lines and outline likely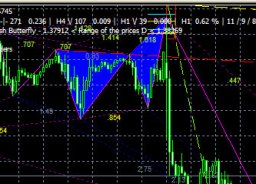 trends.
The zup indicator is a combined script and contains several popular technical indicators, for example, zigzag is used to analyze existing patterns.
A large complex of software tools collected together makes it possible to conduct a complete technical analysis and draw the necessary conclusions.
The result of the zup indicator is the construction of lines and levels, and the key model is the Gartley butterfly, which is built according to Fibo numbers.
In addition, there is text information that fully characterizes the results obtained and serves as an additional advantage in the work.
Download zup indicator.
By installing the indicator in the trading terminal you will see:
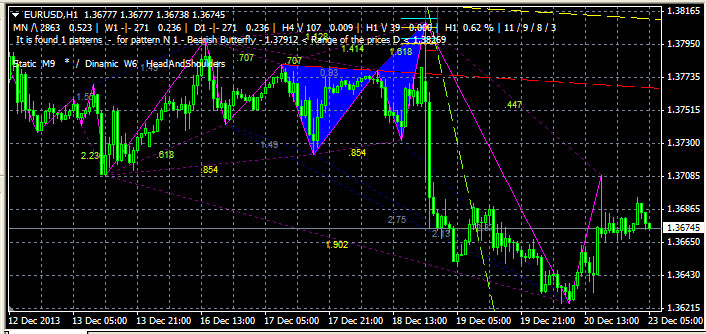
1. Two blue triangles – characterize the pattern that the zigzag indicator defined.
2. Yellow and red lines are the so-called trend lines that determine the main direction of the trend .
3. Horizontal yellow and blue lines according to the Gartley figure - a stop loss and the market is entered.
4. Two lilac lines are the boundaries of the price channel.
Trading using the zup indicator.
There are two options for trading using this technical analysis indicator; in the first case, you can trade in the price channel , which is formed between two lilac lines.
The second option is to find the extreme corner of the triangle using the Gartley butterfly and enter in the direction of the trend.