
Trend Magic indicator – trend guide
Many beginners often face such a problem as determining the global trend.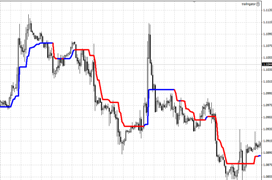 Almost all traders look at local price movements, mistaking pullbacks for a new trend and vice versa.
As a rule, entering against the market always backfires on all of us, because as many psychologists say, “You can’t fight the crowd.”
Indeed, there are various tools, such as trend lines or channels, but often the market diverges so much in different directions that constructing any figures simply does not give us objective information.
The Trend Magic indicator is a trend indicator whose main task is to show the direction of the trend.
This tool is based on two well-known standard indicators, namely ATR and CCI. Actually, in the settings you can find the ability to change the periods of these two indicators, on the basis of which the trend is determined. However, before you start considering trading signals, indicators need to be installed in the Meta Trader 4 trading platform.
To do this, download the archive with the indicator inside at the end of the article. Next, in your trading terminal, go to the file tab and launch the data directory. Copy the indicator file and place it in the indicators folder, then restart MT4. After restarting, in the Navigator panel, open the list of indicators and drag Trend Magic onto the chart of the currency pair. If you carried out the installation correctly, then the following indicator line will appear on the chart:
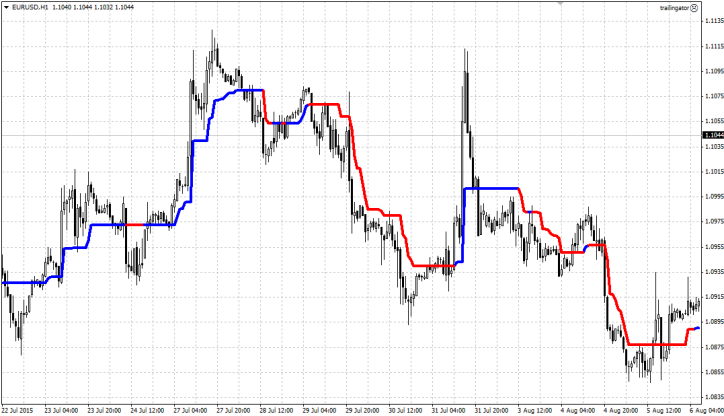
As you can see in the picture, a blue and red line will appear in front of you. At first glance, the indicator resembles a moving average, although in reality it is not. The tool clearly identifies the global trend movement and informs us by changing the color of the line. It is considered that if the line is colored blue, the trend is bullish, and if the line is colored red, it is bearish.
Based on the main feature of showing us trend changes, the application of the indicator itself is built. This tool is often used as a trend filter to the main signal to enter a position. Simply put, a trader buys based on a signal from his strategy only if the Trend Magic indicator line is colored blue, and sells if the line is colored red. You can find this option for using the indicator in various trading strategies that take into account the filter of the main trend direction.
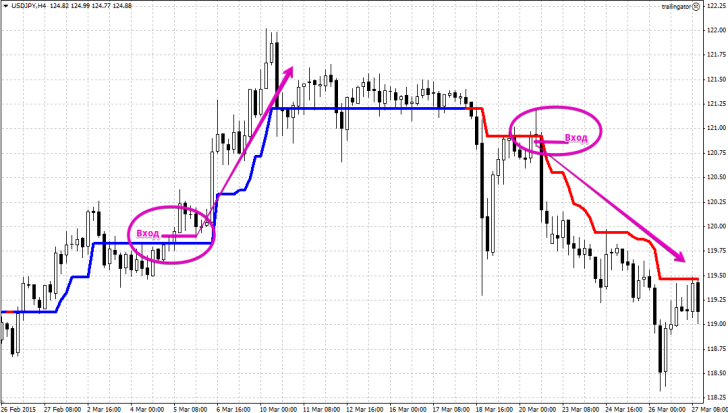
The indicator can also be used to directly enter a position. You should enter a buy position if the indicator line has changed its color from red to blue, and enter a sell position if the color of the line has changed from blue to red. An example of entering a position is shown in the picture below:

The second way to use the indicator to search for an entry point is to enter a position in the direction of the trend after a rollback. A signal to buy an asset is a price breakdown of the blue line from bottom to top. A sell signal is a breakdown of the red line of the indicator from top to bottom. Thus, you enter a position immediately after the end of the price pullback against the trend. You can see an example of a login in the picture below:
A significant advantage of the indicator is that it can help you forget about such a problem as finding an exit point from a position. The trade is closed when the indicator line changes color to the opposite color to the entry into the position.
Of course, this method of exiting a position is a little crude, since all trend indicators have a lagging effect, but it is used by hundreds of traders. In conclusion, I would like to say that the indicator, which seems simple at first glance, turned out to be a multifunctional and useful tool.