Convenient button in MT5
Every year, programs for trading on the stock exchange become more and more comfortable, developers add new features and change functionality.
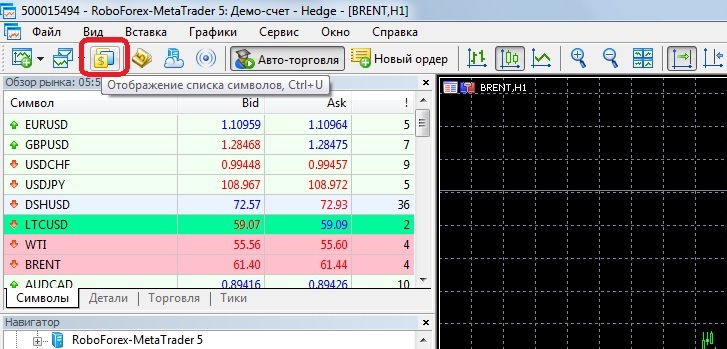
Almost every trader is familiar with the “Symbols” tab, which allows you to add new assets to the market overview panel.
And also receive background information on any asset available for trading and some statistics.
Until recently, there were two options to open this tab, the first was through the “View” top menu item.
The second option is to right-click on “Market Watch” and select the appropriate item from the list that opens.
 On the specification tab, you can select the type of assets; the grouping may be different depending on the broker:
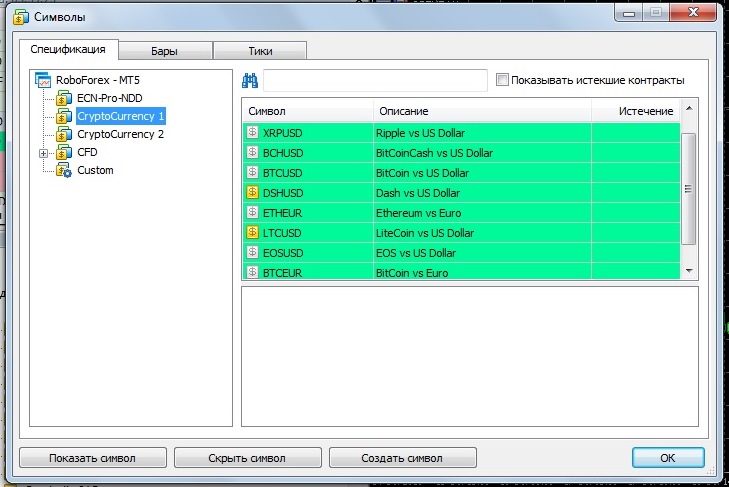 In our case, these are:
• Currency pairs
• Crypto currencies
• CFDs – indices and oil
If on the right side of the tab you click on one of the assets, for example, ETHEUR, you will see its more than detailed specification:
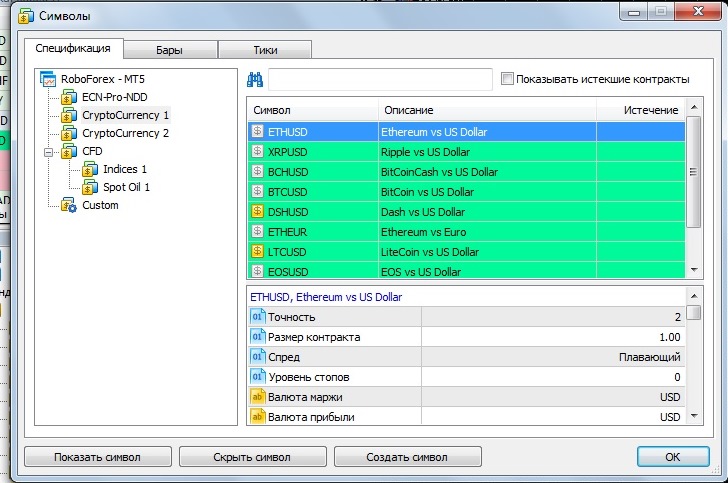 The specification contains information ranging from the size of the contract and commissions to the schedule of trading days.
In addition, thanks to the “Symbols” tab, you can get statistical information on bars and ticks:
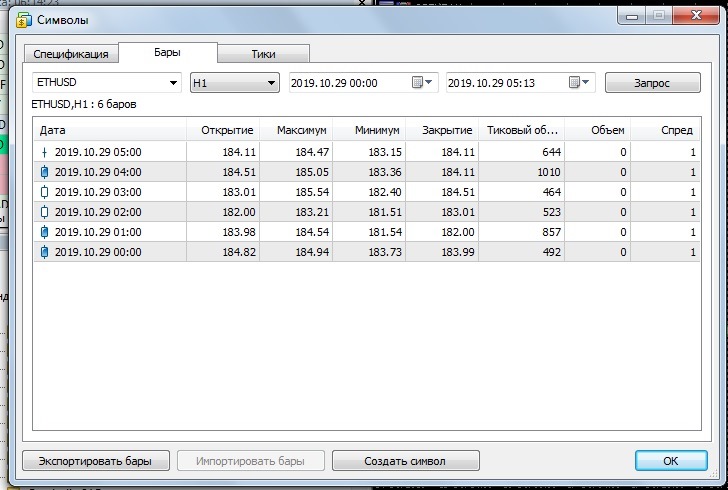 The “Bars” window makes it possible to analyze this indicator depending on the selected time period.
Find out the values of the minimum and maximum prices on each bar, opening (closing) data, as well as tick volume. Switching to the Tiki window:
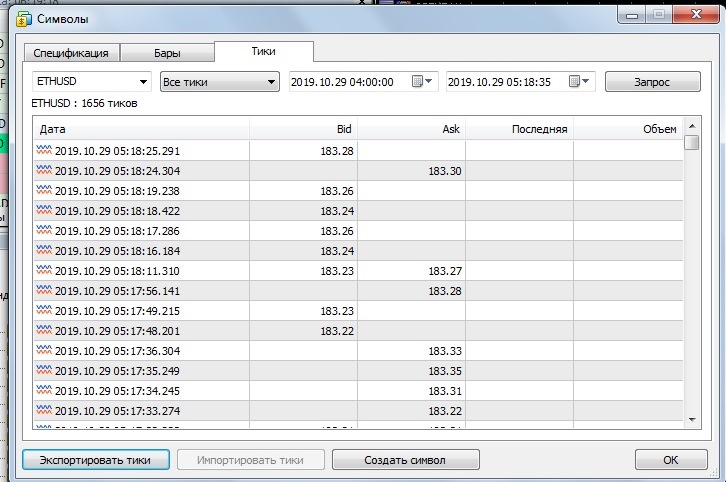 You can see how the price changed in ticks during a certain day and period of time.
In terms of its content, the “Symbols” tab is simply a storehouse of information; it allows you to find out everything you need about a certain asset and use the acquired knowledge to make a profit in stock trading.
