Aggregate Position Indicator
Probably, each of you dreamed of looking on the other side of the market, to see where traders’ positions stand, in which direction the majority of players are aiming. Indeed, if you could master such valuable information, you would always be able to analyze the logic of the crowd, their behavior and, in a short-line perspective, predict the possible price movement.
Broker Amarkets is the first who was able to provide such information to its clients for general review.
Of course, you will not be able to obtain information about the order values of all traders, because even the broker does not know about this, but you can always see in which direction AMarkets clients are trading and draw conclusions based on the information received.
You can probably make a case that a handful of clients of one brokerage have no impact on the multi-billion dollar flows of money that move prices. Of course, your arguments will be correct, but even with this information, you will be able to grasp the underlying trend, since all traders share the same trading characteristics, we all learned from the same books and use the same fundamentals.
Based on the data held by the brokerage company Amarkets on open and closed client orders, the Cumulative Position Indicator was created. Its essence is that for different groups of traders a price range is formed, on which the aggregate positions in one direction or another are marked.
The tool itself with its full functionality is available to all clients in their personal account, so you do not need to install it into the trading platform.
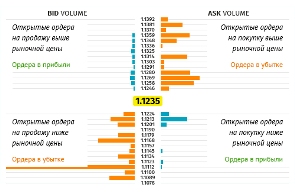
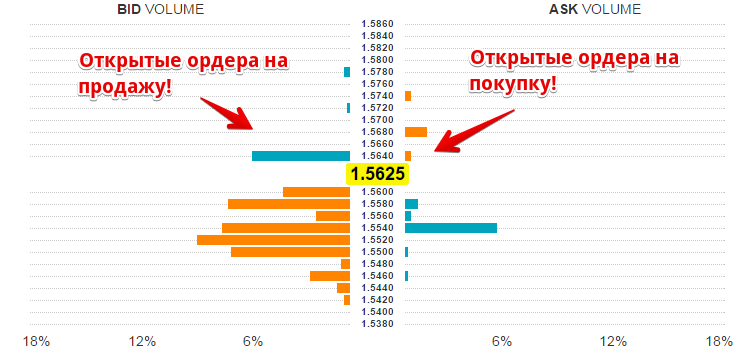
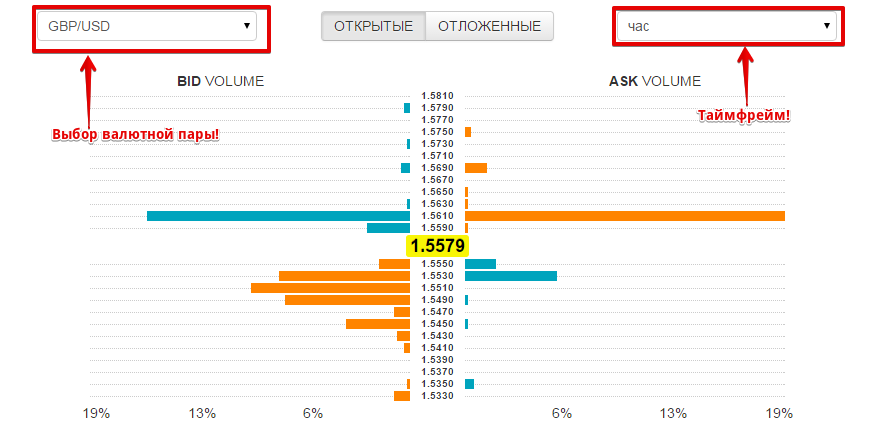
In order to find the indicator on the main page, go to the Laboratory section and click on the line “Cumulative Position Indicator”. After you launch it, the indicator itself will appear in front of you, which is divided into two halves. The first half is called Bid Volume and it displays sell orders. The right half is called Ask Volume and it shows us buy orders. Using the chart, traders' orders at certain price levels are marked.

You also have the opportunity to choose any currency pair and time frame on which traders trade. I would like to note that the larger the time frame you choose, the larger the price range that open client orders will be displayed. The indicator highlights the current price in bright yellow and, as a rule, it is in the middle of the range.
The developers of this indicator made sure that the user could easily recognize its readings. So, for example, if the diagram is colored blue, this means that open orders are in profit, and yellow - orders are in loss. Based on these readings, you can see how the crowd behaves and try not to become part of it.

If we look at the example of the pound dollar currency pair, you can see that a large number of traders are selling, and at a loss. This may tell us that large players will most likely continue to move the price up in order to collect the stops of the crowd that is against the trend.
In conclusion, I would like to say that the Cumulative Position Indicator is quite a useful tool, because you can always track whether your trade is going in the right direction.
Moreover, based on the analysis of crowd behavior, you will be able to quickly respond to any changes in the market. You can assess the current situation on open positions at http://www.amarkets.org/
