
Retail sales volume in Australia. Impact of the news on the AUD/USD currency pair
The volume of retail sales has a direct relationship with the Australian dollar exchange rate. Thanks to this indicator, a trader can easily assess the state of the Australian economy, the dynamics of development, or, paradoxically, its deterioration.
The essence of the index is that information is taken on all retail sales from various store owners and points of sale of retail goods, and both small businesses and large retail chains that engage in retail trade are taken into account.
What can retail sales data tell us?
Yes, first of all, about the availability of money among the citizens of the country. If citizens actively buy goods and turnover from retail chains does not decrease, but rather increases, this tells us that people are earning money, have a strong support in the form of the state and a healthy economic climate, thanks to which social standards and the well-being of the country as a whole are increasing.
You can continue the chain of increasing tax collection, increasing the budget and strengthening the country’s economy, but this is not so important, since understanding from sales that people are getting richer, you can easily apply this news in trading and interpret it without any problems.
In order to understand how the news affects the movement of the chart, let's look at the results of the last four months. The news is published on a monthly basis, namely on the first days of each new month.
A historical study of the distance that was traveled at the time of the release of Retail Sales Volume on the Australian/Canadian currency pair will help us determine a possible trading strategy and roughly calculate its effectiveness.
Why did you choose this particular couple? The point is the low spread , which averages three points, so it is most often used when using fundamental analysis for AUD.
On 06/04/2015, most analysts were inclined towards a possible increase in retail sales and expected a level of 0.4 percent. In fact, the news came out with a negative rate of 0.0 percent and even less than the previous month's data, which was 0.2 percent. Therefore, based on this data, the chart of the AUD/USD should rapidly go down. You can see the real picture of what is happening in the picture below:
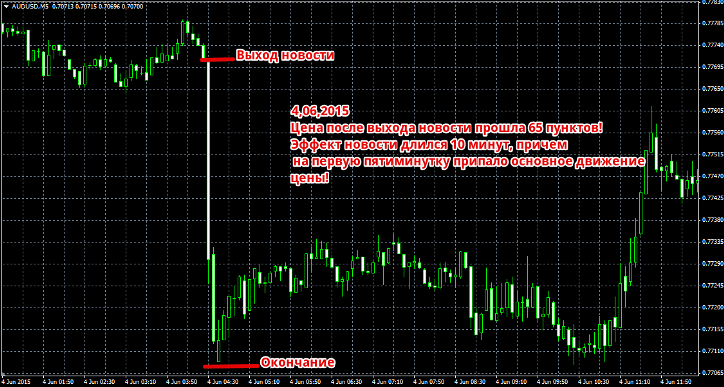
The chart shows that after the news was released, the price quickly rushed down by 65 points. The effect of the news lasted only ten minutes, and the main price movement occurred in the first five minutes.
This indicates high volatility and broken expectations of market participants. After the news was processed, the price entered a multi-hour sideways trend, after which a return to the original positions could be observed.
On July 3, 2015, data on retail sales volumes that were released also shattered all the expectations of investors and market participants. However, unlike the previous version, the released figure was higher than the previous one, but much less than what was predicted by experts. Therefore, it was quite obvious that the chart of the AUD/USD currency pair would go down. An example can be seen below:
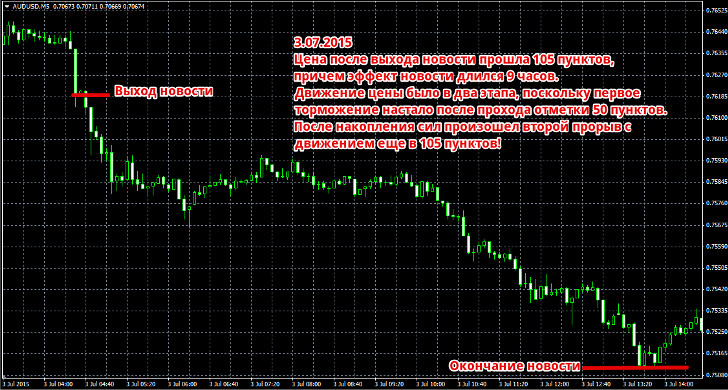
The news worked really well, taking the course 105 points down. It is worth noting that after the price passed 50 points, traders began to have doubts, which were visible in the form of a small rollback and sideways movement, but after a couple of hours the chart moved down with renewed vigor. The effect of the release of retail sales data lasted 9 hours.
On 08/04/2015, a noticeable increase in retail sales could be observed, which amounted to 0.7 percent compared to previous data of 0.4 percent. Therefore, according to the laws of economics, one would expect a strong strengthening of the Australian dollar, which could be seen in the form of growth in the chart of the AUD/USD currency pair. An example can be seen in the picture below:
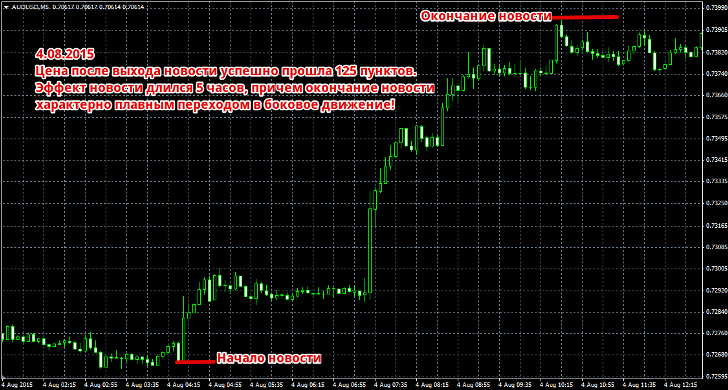
The market reacted quite as expected, so the price easily covered a distance of 125 points. I would like to separately highlight that the effect of the news influenced the market for 5 hours, and the end of the action resulted in a smooth transition to a flat.
On September 3, 2015, another negative data on retail sales was released, and if they predicted a drop from 0.6 percent to 0.4, then in fact they received -0.1 percent. Based on such bad data, it can be assumed that the chart of the AUD/USD currency pair should go rapidly down. You can see the real market reaction in the picture below:
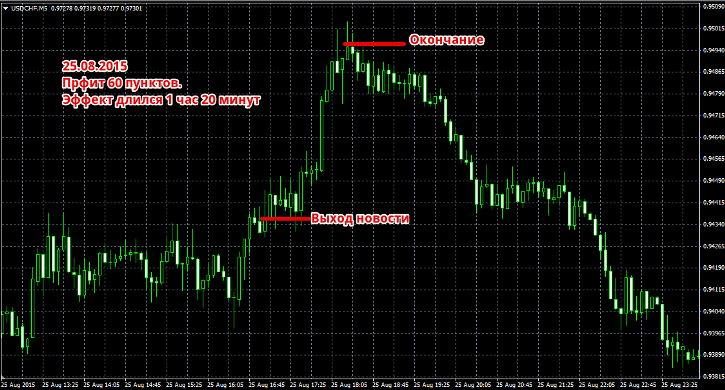 Despite the fact that the overall effect of the news lasted for 4 hours and 25 minutes, the main price movement occurred in the first five minutes. After the release of the indicators, the price successfully passed 45 and at the end of the movement entered a wide extended multi-hour flat .
Summarizing, we can say that the reaction to the news is extremely variable, and the distance that the price travels after the news is released is also quite different, from 45 points to 120. However, you can notice that the price immediately reacts sensitively to the release of indicators, so in four In the examples you will not see that the graph would go against the news.
This primarily tells us that large players do not have the courage to try to enter against the crowd and knock out some of the players with small stops, so trading using this news is less risky than many others.
If we talk about numbers, then with a rough calculation, if we take the minimum distance traveled by the price, we get the following numbers: 45+45+45+45=180 points of profit. Remember, trading on news requires you to have a broker with high order execution and no requotes !