
FractPrice indicator
Based on the research of many traders and analysts, the price is in so-called sideways or wide flats almost 70 percent of the time.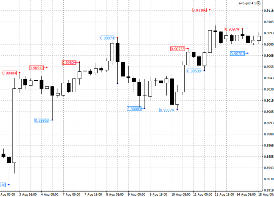
Market activation, as a rule, occurs after the breakdown of the next extreme or support and resistance levels.
One of the first traders who noticed the importance of identifying extreme points and was able to specify the determination process itself by creating his own indicator was Bill Williams.
It was he who introduced the concept of Fractals in the stock and foreign exchange markets, proposing the concept of taking as a basis five candles and the highest point, which, as a rule, is in the middle of the candle combination.
Thanks to the fact that Bill published his own book, in which he revealed the secrets of his trading strategy.
Despite the fact that the algorithm itself is very simple, in practice a trader can perform many tasks with its help. Actually, in this article we will talk about the custom FractPrice indicator, which is an improved version of Bill Williams’ famous fractals.
The FractPrice indicator is a technical analysis tool based on the concept of fractals from Bill Williams. It is worth noting that the indicator works similarly to the standard version and determines extreme points using the same algorithm, however, to simplify perception, the visualization has been changed.
Now, unlike standard fractals, a trader can see a specific price on the chart, which simplifies working with orders.
The indicator itself is multi-currency and can be used on absolutely any currency pair and time frame, since trends and the formation of extremes occur on absolutely all trading assets.
Installing the FractPrice indicator
The FractPrice indicator is a custom modification of the standard Fractals indicator, so in order for you to use it you will need to download the tool file at the end of the article and then install it in your MT4 trading platform.
The installation process of the FractPrice indicator follows a standard scheme and is no different from installing any other custom indicator, namely, you will need to drop the downloaded FractPrice indicator file into the appropriate folder in the terminal data directory.
In order to access the platform data catalog, launch your trading terminal and in the upper left corner of the platform, enter the “File” menu. After launching the trading menu, you will see a list of options, among which find the line called “Open data catalog.”
Having launched the data directory, a list of platform system folders will be displayed on your monitor screen, among which find the folder called Indicators and drop the previously downloaded FractPrice indicator file into it.
In order for the trading terminal to be able to see the installed instrument, it must either be restarted or updated in the “Navigator” panel. After restarting MT4, FractPrice will appear in the list of custom indicators.
To use the indicator, just drag the name of the instrument onto the chart.
The principle of using indicators.
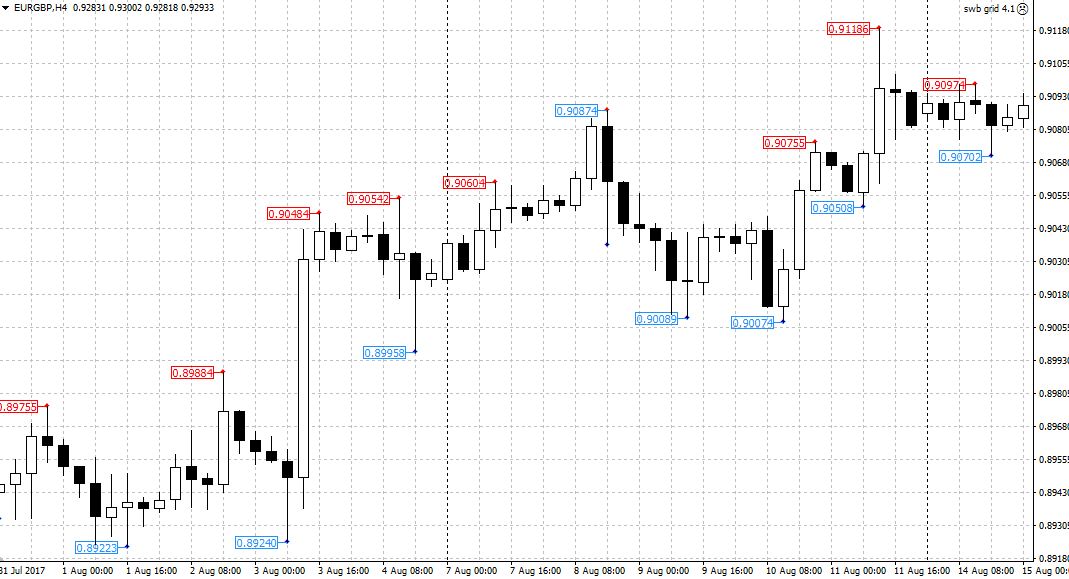
After applying the indicator to the chart, you can see red and blue dots in places where fractals are formed, as well as their price. It is worth understanding that red dots and captions show us local maxima, and blue dots and captions show us local minima.
If we talk about the principles of using the indicator, they can be divided into two functions. Thus, the tool can perform both a signaling function and become an excellent assistant for supporting transactions.
If we talk about the signal function of the indicator, we can highlight its importance for many breakout strategies.
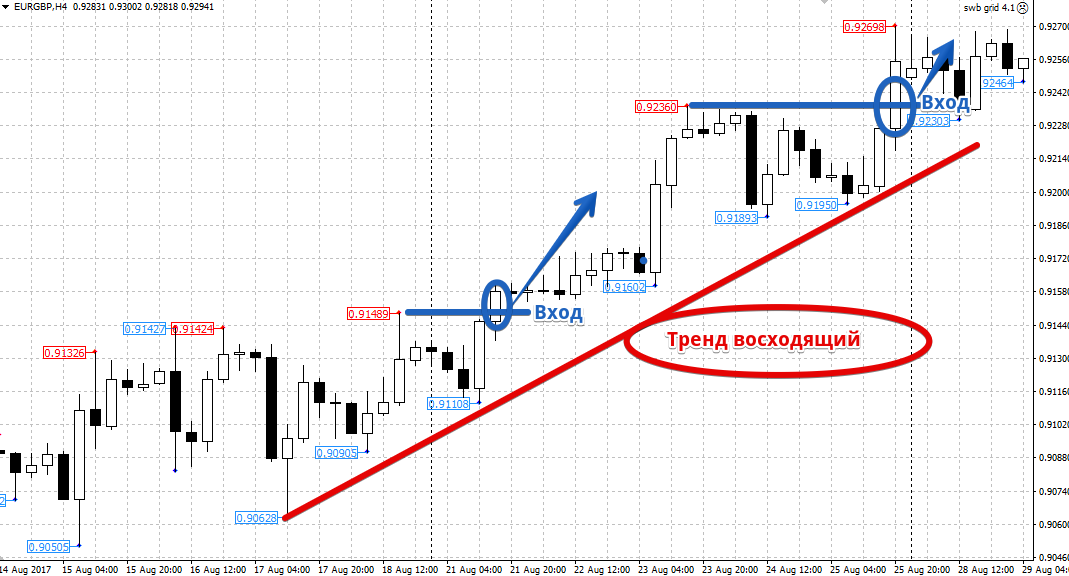
So, if there is an upward trend in the market and a local maximum (red dot) has formed, the trader sets the price at the specified price buy stop pending order, or enters a breakout of the stated level with a market buy order.
If a local minimum (blue dot) has formed in a downward trend, you need to place a pending sell stop order at the specified price, or open a market sell order when the stated level is broken. Example:
If we talk about the auxiliary function of the FractPrice indicator, it is worth noting that it allows you to find points for setting stop orders, which, as a rule, are located several points from local minimums and maximums, depending on the direction of transactions.
Also, based on local extrema, one can carry out trailing stop your position, which will undoubtedly allow you to hold your position for as long as possible.
Summing up what has been written, we can safely say that the FractPrice indicator is a fairly universal tool and can be useful to all categories of traders.
However, you should not use the indicator alone, since identifying extremes alone without using additional filters is not enough to build a profitable strategy.
Download FractPrice Indicator