Ichimoku indicator – master of long-term trading
The Ichimoku indicator is a trend tool that was developed back in the 60s by the Japanese journalist Hosoda.
Working for the famous Japanese stock exchange magazine Nikkei, Goichi Hosoda was constantly exposed to market analysis, wrote various educational articles and conducted analytical reviews of popular exchange instruments.
After studying a lot of information, Hosoda decided to create his own technical analysis tool that would be capable of conducting long-term analysis.
As you understand, at that time the world was far from trading through personal computers, so Hosoda hired students on an ongoing basis, who, roughly speaking, brought his idea to life with a pencil on a large Whatman paper.
The Ichimoku indicator is a trending tool that can only be used on daily or weekly charts. Of course, craftsmen manage to optimize the parameters and use it intraday, however, due to the strong delay, all such ideas get a naturally predictable result.
Many people call the Ichimoku indicator not a stock exchange tool for a speculator, but rather a tool for a long-term investor, since positions opened using its signals can last for weeks, or even months.
Plotting Ichimoku
The Ichimoku indicator is a globally recognized technical analysis tool, so no matter what trading platform you use, the indicator is present in each one. In Mt4, the tool is located in the trend indicators section, so you just need to drag it onto the daily chart of any currency pair .
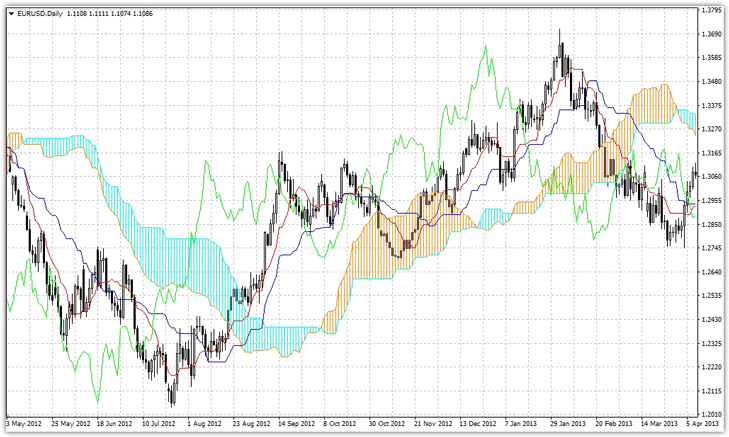
Ichimoku Settings
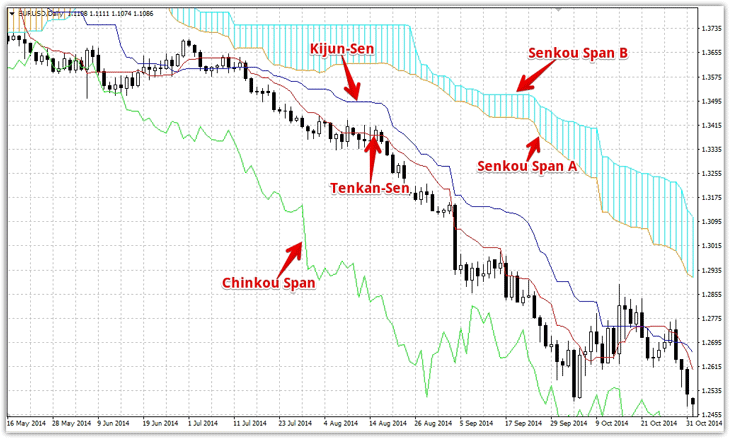
The Ichimoku indicator consists of five lines, which provide simply a huge variety of trading signals and are even capable of predicting the development of a future trend. So let's break it down line by line:
1 Tenkan-Sen. This line is drawn based on the average value between the high and low based on 9 candles. Simply put, the point for drawing the Tenkan-Sen line is in the middle of the candle between its high and low.
It is colored red on the chart and displays the direction of the trend in the short term.
2 Kijun-Sen. The principle of constructing this line is no different from Tenkan-Sen, the only thing that shows the medium-term trend and uses 26 candles for calculation. It is shown as a blue line on the graph.
3 Senkou Span B. This line is built on the principle of Tenkan-Sen and Kijun-Sen, the only thing is that it is shifted 26 bars to the right and uses the average value between the high and low of 52 candles. It is shown in blue on the graph and is part of the so-called “Cloud”.
4 Senkou Span A. This line is not displayed in the indicator settings, however, it is built as half between the Tenkan-Sen and Kijun-Sen lines and is a brown line forming a cloud. This line is also shifted 26 candles forward.
5 Chinkou Span. This line is displayed in green with a shift of 26 bars back.
Ichimoku indicator signals
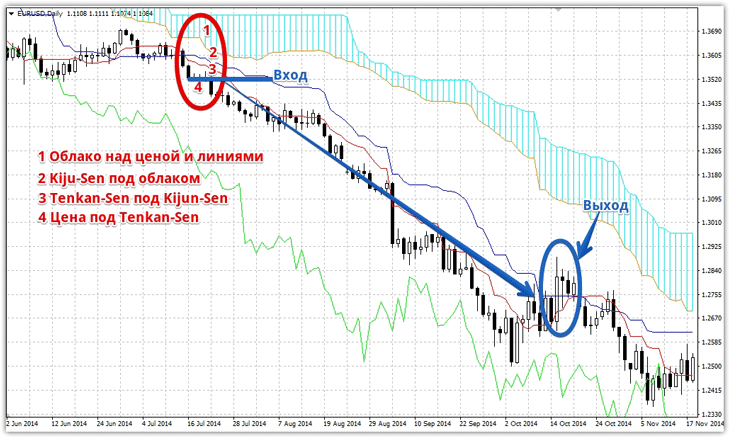
The Ichimoku indicator is a huge storehouse of trading signals that have their own strengths and weaknesses. The strongest signal is considered to be the “Three Line Signal”, which signals the strongest development of the trend.
To enter a sell position, the lines must be in the following position:
1) There is a cloud above the price and the Kijun-Sen and Tenkan-Sen lines.
2) The Kijun-Sen line should be located under the cloud.
3) Below the Kijun-Sen line is the Tenkan-Sen line.
4) The price is below the Tenkan-Sen line.
If you see such a configuration, you can safely enter a sell position. Exit from the position occurs when the price crosses the Kijun-Sen line. Example:
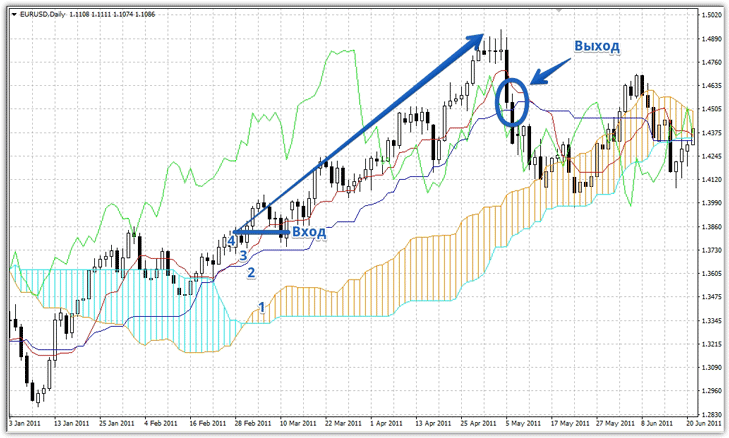
To enter to buy, the lines must be in the following position:
1) Below, under the price and the Kijun-Sen and Tenkan-Sen lines, there is a cloud.
2) The Kijun-Sen line should be above the cloud.
3) Above the Kijun-Sen line is the Tenkan-Sen line.
4) The price is above the Tenkan-Sen line.
If you see such a configuration, you can safely enter a buy position. Exit from the position occurs when the price crosses the Kijun-Sen line. Example:
Also, the Ichimoku indicator gives a weaker signal, which is called the “Golden Cross” and “Dead Cross”
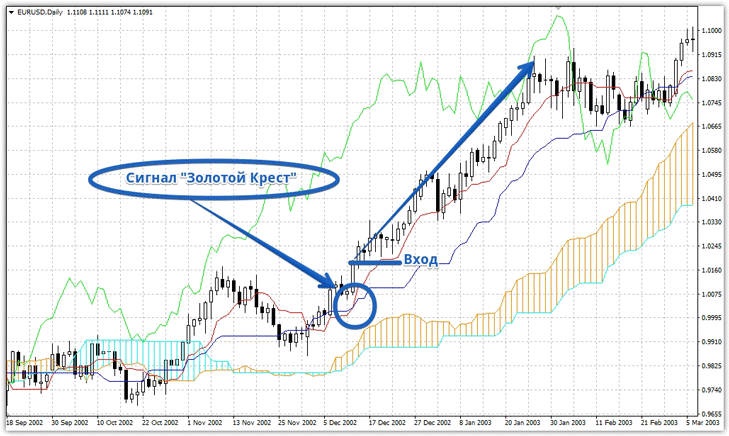
The “Golden Cross” buy signal appears when the Tenkan-Sen line (red line) crosses the Kijun-Sen (blue line) from bottom to top. Example below:
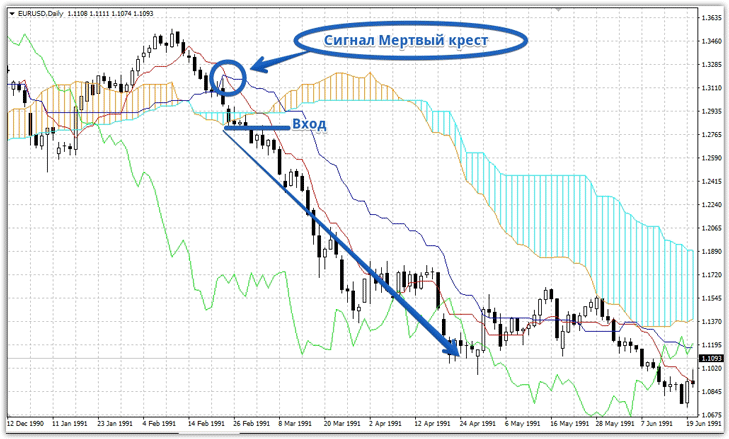
A Dead Cross sell signal appears when the Tenkan-Sen line (red line) crosses the Kijun-Sen line (blue line) from top to bottom. Example below:
Warning signal of a trend change
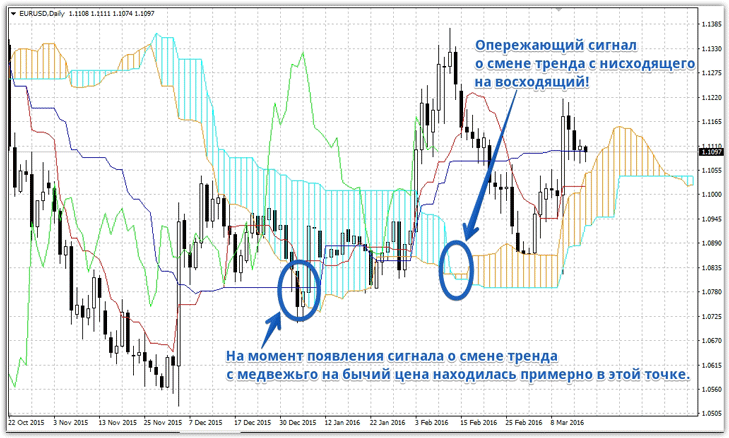
As previously written, the Senkou Span B and Senkou Span A lines, which are shifted to the right beyond the chart by 26 bars and form a cloud, can predict a future change in trend direction.
It is worth noting that due to the shift to the right by 26 candles to the right, the cloud on the history is quite difficult to show the effectiveness of this signal, but you should definitely know:
1) If the Senkou Span A cloud line crosses the Senkou Span B cloud line from bottom to top, a trend reversal is coming from bearish to bullish.
2) If the Senkou Span A cloud line crosses the Senkou Span B cloud line from top to bottom, a trend reversal is coming from bullish to bearish.
Warning signal of a trend change with the Chinkou Span line
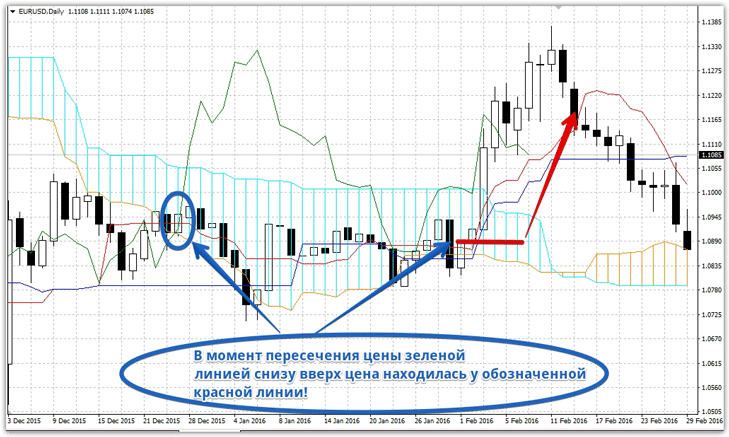
The Chinkou Span line is an excellent indicator of a change in the global trend direction. When we described this line, you learned that it is shifted 26 candles back. A signal for a change in the global trend is the intersection of the price (graph) with the Chinkou Span line (green line).
1) If the green Chinkou Span line crosses the price chart from bottom to top, the price will change its global trend to an upward one.
2) If the green Chinkou Span line crosses the price chart from top to bottom, the price will change its global trend to downward. Signal example:
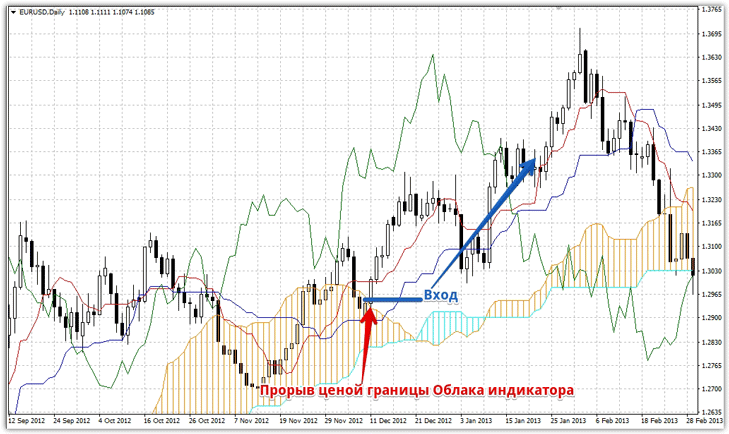
There is also an additional signal to enter a position when the price is inside the cloud formed by the Senkou Span B and Senkou Span A lines.
If the price has entered the cloud, then these lines act as support and resistance lines, and signals to enter a position may appear if one of the boundaries of the cloud is broken through or if the price pushes away from one of the boundaries.
 In addition to the signals discussed in this article, signals are also used when the price breaks through the Kijun-Sen and Tenkan-Sen lines or the price rebounds from these lines. Actually, the Inchimoku indicator is not just a trend tool for technical analysis , but a full-scale trading strategy that gives signals in almost any market conditions.
The only thing that every trader needs to understand is that Ichimoku is a tool for long-term trading.
