ZigZag indicator – trend detection master
Market noise creates very large interference in determining the global trend.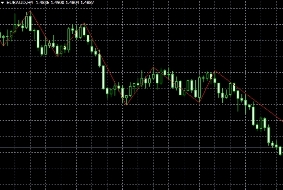 Many beginners experience great difficulty in determining a trend, because the tortuous movements of the market simply do not allow one to quickly assess the global direction by eye, and each trough or peak is considered as a new direction of the trend.
Let us not lie, because even professionals in their field often make mistakes with the direction of the trend during the trading process, since sharp strong impulses against the main trend, which can be up to 50 percent of the current trend, mislead even the most experienced exchange players.
The ZigZag indicator belongs to the so-called non-trading indicators, which have the task of showing the current situation on the market, and not giving specific signals for entering a position.
A special feature of the script is that it connects extreme extremes with lines, thus smoothing the price movement between selected local minimums and maximums .
Plotting
ZigZag is a trending tool that was introduced into the MetaTrader 4 trading platform by default.
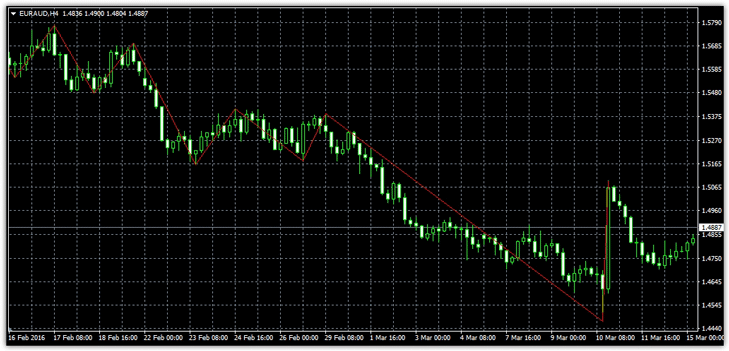
The developers classified this tool in the category of custom indicators, so to plot it on a chart you should enter the navigator panel, open the indicators section and find the custom category. Then you just need to drag the script onto the chart.
ZigZag settings
When you enter the ZigZag settings, you will see only three parameters, which are the basis for building the indicator.
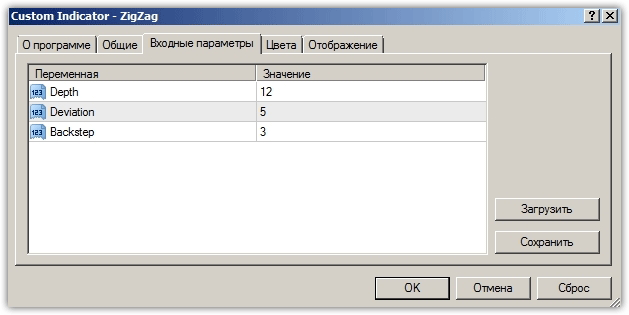
The Backstep line specifies the smallest number of bars or candles that is necessary for the indicator line when constructing it.
The Deviation line specifies the minimum distance as a percentage between the local minimum and maximum. The Depth line specifies the number of bars that the indicator needs to draw a new extreme.
Application options for ZigZag
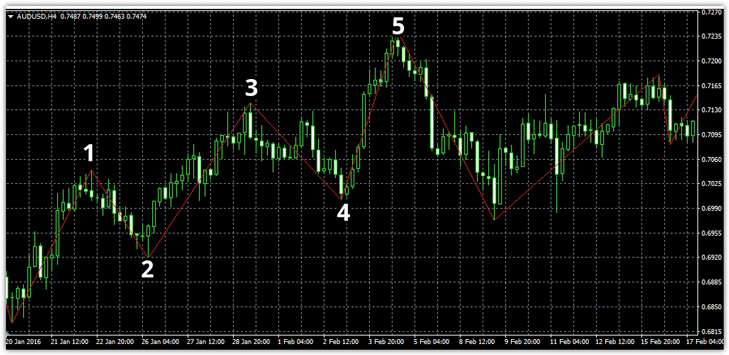
The ZigZag indicator is an excellent assistant for recognizing various reversal patterns . So, thanks to the connecting lines between the extremes, it is very easy to recognize such a pattern as “Double Bottom”, “Double Top”, “Triple Bottom”, Head and Shoulders.
An example of identifying figures is shown in the picture below:
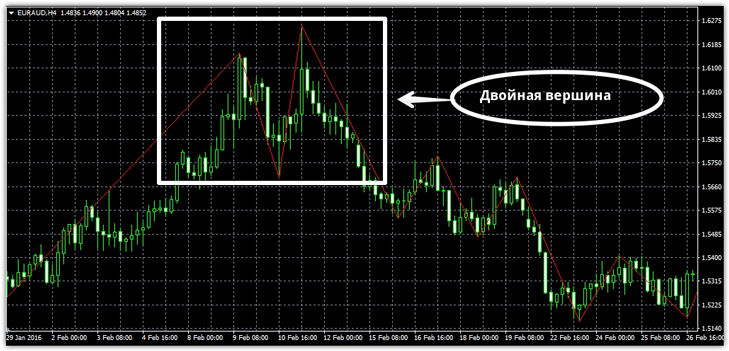
In addition to identifying chart patterns thanks to smoothing, ZigZag is simply the best assistant for traders who actively use the Eliot wave theory.
Despite the auxiliary function of the indicator, traders noticed a rather interesting pattern, which was called the ZigZag pattern.
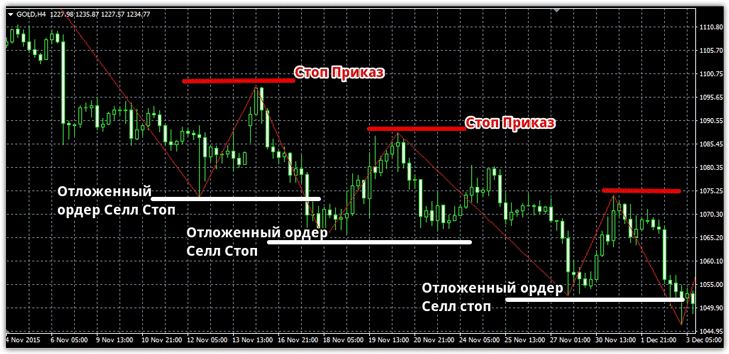
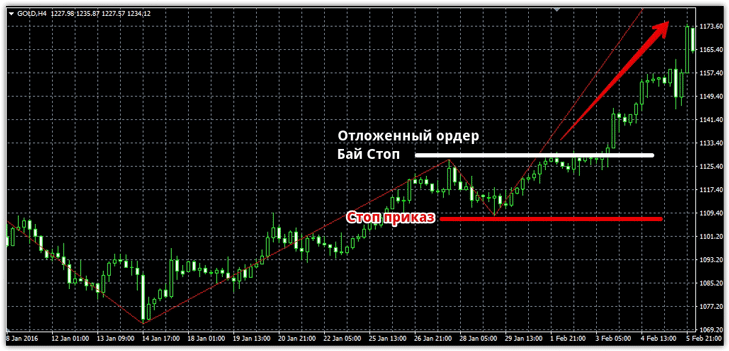
The essence of the pattern is to place a pending sell stop order at a local minimum formed by the ZigZag indicator, and a buy stop at a local maximum formed by the ZigZag indicator.
Thus, this approach resembles a breakout trading strategy, where all positions will be opened purely in the direction of the main trend.
An example of a pattern with a sell signal is shown below:
An example of using the ZigZag pattern with a buy signal:
Also, many novice traders often have difficulty setting stop orders, which, according to almost all the rules of training textbooks, must be set at local minimums or maximums.
The indicator completely solves this problem, since its construction is reduced to connecting points of local minimums and maximums.
Thus, the tool can be used not only to search for local minimums and maximums, but also help build various graphical analysis tools for which it is very important to find these levels, such as when using the Fibonacci Fan or Fibonacci Levels .
In conclusion, it can be noted that the ZigZag indicator is not just an excellent tool that allows you to filter out market noise and see the current trend, but can also perform various additional functions.
