
Reversal candle combinations
The vast majority of traders never pay attention to candlestick combinations when trading. For them, Japanese candlesticks are nothing more than a display of the price that has passed over a certain period of time.
However, more experienced players know that patterns can carry a lot of information about an impending storm, about the weakness of bulls and bears at a certain moment, and, strangely enough, about a possible price reversal.
There are a very large number of candlestick combinations; if my memory serves me correctly, there are more than thirty of them, and the information on how to use them does not fit even in a two hundred page textbook.
However, despite the wide variety of candlestick models, no more than ten pieces are actively used by traders, and if we talk about reversal patterns, then if five pieces are in service, then that’s good.
The fact is that some of them are extremely rare, and recognizing most of them in time turns out to be a great difficulty for most traders. Therefore, today I would like to introduce you to reversal candlestick combinations that you see on your chart every day, but due to lack of knowledge, you simply bypass their signals.
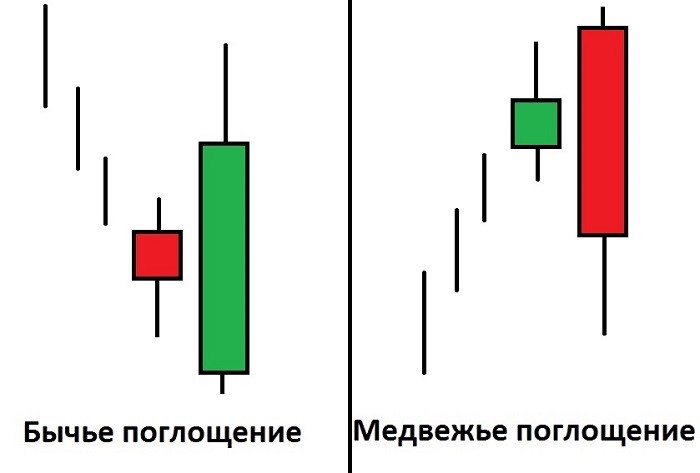
In order to make it easier to remember the names of candlestick combinations, the Japanese have always visualized them in some way, so behind the names that seem funny at first glance lies a truly sound approach to learning. The most popular reversal pattern that you actually see every day is the Absorption pattern.
Its essence lies in the fact that when the price moves in a certain direction, a candle appears, which is directed in the opposite direction, and it is of such a size that it seems to absorb the previous one along with the shadows.
There are bullish and bearish engulfing, and the difference between them is the candle that engulfs the previous one; in a bullish case, the bearish candle is engulfed by the bullish one, and in a bearish case, the bullish candle is engulfed by the bearish one. This candlestick reversal combination occurs very often, and it works on any time frame.
Scalpers especially love this reversal combination, since it always serves as a signal for a timely exit from a position or a trend reversal. You can see this pattern in more detail in the picture below:
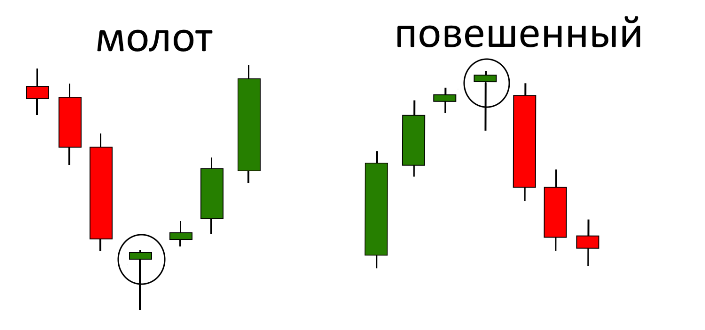
The second no less common reversal candlestick combination is “Hammer and Hanged Man”. The names of the combinations really resemble images, for example, “Hammer” has a small body and a large lower shadow, while the upper one is very small or absent altogether. Therefore, the candle seems to remind us of a hammer, no matter from which side we look.
This combination occurs at the peak of the trend and tells us that the trend is currently running out of steam and that the initiative will soon be seized by the opposing side, which will lead to a trend reversal. The hammer is a very popular pattern and works very well on the four-hour and daily chart. It is also noteworthy that the hammer most often appears at support and resistance levels, which may tell us that players simply do not have the strength to break through this price level, and the price will roll back to the previous level.
However, after the price rolls back and strengthens, a new breakout attempt may occur, so you must understand that the Hammer indicates the nearest reversal, and whether it is a rollback or a global change in trend, you need to be guided by fundamental indicators. The difference between a hammer and a hanging man is only in what trend it arose.
So, in a bullish trend, the appearance of a candle resembling a hammer is called a hanging candle, and in a bearish trend, it is called a hammer. You can see an example of a hammer and a hanged man in the picture below:
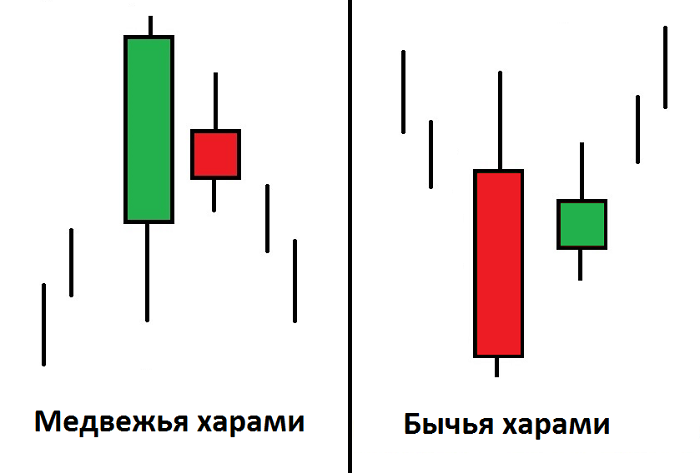
The third candlestick combination that can most often be found at the end of a trend is Harami. Behind such an interesting Japanese name lies a sudden Russian translation, which is designated as Pregnant.
The pattern consists of two candles, and the first one should be long (no matter bullish or bearish) and the second one, which appears, should be in the middle of the previous one, reminding us of a mother with a child in her tummy. Despite this abstraction, the pattern is considered very strong, so when it appears, you should understand that at this stage the trend has simply run out of steam and a rollback will begin.
Many traders stumble over this pattern, believing that this is the ideal entry point for trend continuation, since the entry does not occur at the peak. However, this is a deep misconception, which leads to stop orders being triggered. Remember, you see Harami - get ready for the trend to come to an end! You can see an example of Harami in the picture below:
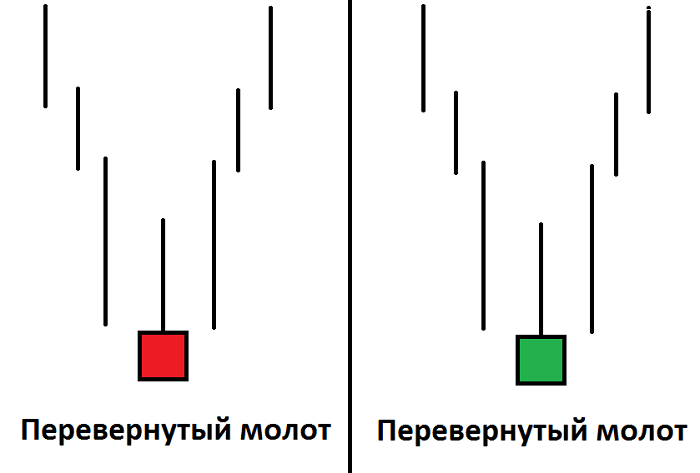
The fourth reversal candlestick pattern that you can often see on your charts is the Inverted Hammer. This combination is no different from the “Hammer” pattern, however, the difference is that the shadow is not directed downwards as in a hammer, but rather upwards. It is considered a strong bullish signal that occurs at the bottom of a bearish trend.
In order to safely enter a position, you need to wait for the second candle, which should also be bullish. If this does not happen, then I recommend simply ignoring this signal, considering it not confirmed. You can see an example of the “Inverted Hammer” in the picture below:
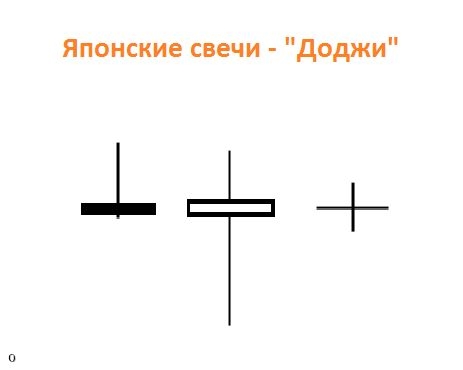
Many who have ever come across information on candlestick patterns probably thought, what about “Doji”? Indeed, the Doji pattern is the most common, but it does not show a clear reversal point, as it is often thought of. For those who don’t know, a “Doji” consists of two or one long shadow, while the body of the candle itself is missing.
The appearance of the “Doji” may tell us about the creeping doubt of the bulls or bears that are moving the price. However, this does not mean that there will be a reversal, because after a short pause the movement can resume with renewed vigor. If you are buying or selling and a Doji appears in front of you, this is probably the best moment to think about the exit point from the position and be prepared for new turns. You can see an example of a pattern in the picture below:
 In conclusion, I would like to note that, as a rule, reversal candlestick combinations occur before the release of news or important statements. Therefore, you will always be aware in advance that there will be a reversal soon, and not like an ordinary trader who enters a position almost at the end of a trend or exits a position with lost profit due to the fact that an unexpected reversal simply gobbled up all the profit.
Thank you for your attention, and I hope you will also actively monitor the price chart and avoid the mistakes that many make. Good luck.