
Chaos reversal indicator
The market has extremely unpredictable behavior, and price movements are more reminiscent of chaos than the well-known phase of a trend or flat.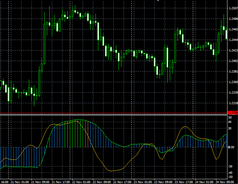
Unfortunately, or maybe fortunately, it is its unpredictability and chaotic movement that allows millions of traders around the world to make money.
Just imagine if the market did not have a chaotic price movement with a tendency towards a certain trend, but a clear directional trend that everyone could determine.
In this case, no one would be able to make money, since in financial markets they only make money when everyone else loses.
The Chaos indicator is a technical analysis tool popular among traders, thanks to which you can consider the current direction of the trend and throw market chaos into the background.
The indicator itself is an oscillator, so you can use it on any currency pairs and time frames. The most interesting thing is that the Chaos indicator belongs to the so-called complex technical analysis tools, namely, one indicator can act as a holistic strategy for forex.
Installing the Chaos indicator
In order to use the Chaos indicator in practice, you will need to go to the end of the article and download the indicator, and then install the instrument in the MT4 trading terminal.
The indicator installation procedure follows the standard scheme, namely, you will need to place the Chaos indicator in the appropriate folder in the data directory of the MT4 trading terminal. In order to access the catalog, launch your trading platform and go to the file menu in the upper left corner.
You will be presented with a list of options, among which you will need to find and launch the Data Catalog.” After launching the directory, a list of system-important folders will be displayed on your desktop, among which look for a folder called indicators, drop Chaos into it, and then close the data directory.

In order for the terminal to see the appearance of a new instrument, you will need to update the navigator panel, or simply restart the trading platform. After restarting the terminal, you can apply the Chaos indicator by simply dragging it onto the chart.
Meaning of lines. Application of the indicator in practice
As you can see in the chart above, the Chaos indicator consists of a histogram as well as a separate signal line, which is displayed as yellow. The principle of operation of the indicator is quite simple, namely, it determines the current direction of the trend depending on the position of the histogram in relation to the zero line.
So, if the histogram is above level 0, the market is in a bullish trend. If the indicator histogram is below level 0, the market is bearish trend.
Based on the location of the histogram, you can build a simple strategy, namely, if the histogram crosses level 0 from bottom to top, we enter a buy position, and if from top to bottom, we enter a sell position. Example of signal processing:

Also, during the trading process, you should pay attention to the color of the histogram. Thus, the blue color of the histogram indicates to us the presence of a stable trend, while green marks zones of probable reversal. The red color of the histogram indicates a slowdown in price, namely its entering a sideways movement.
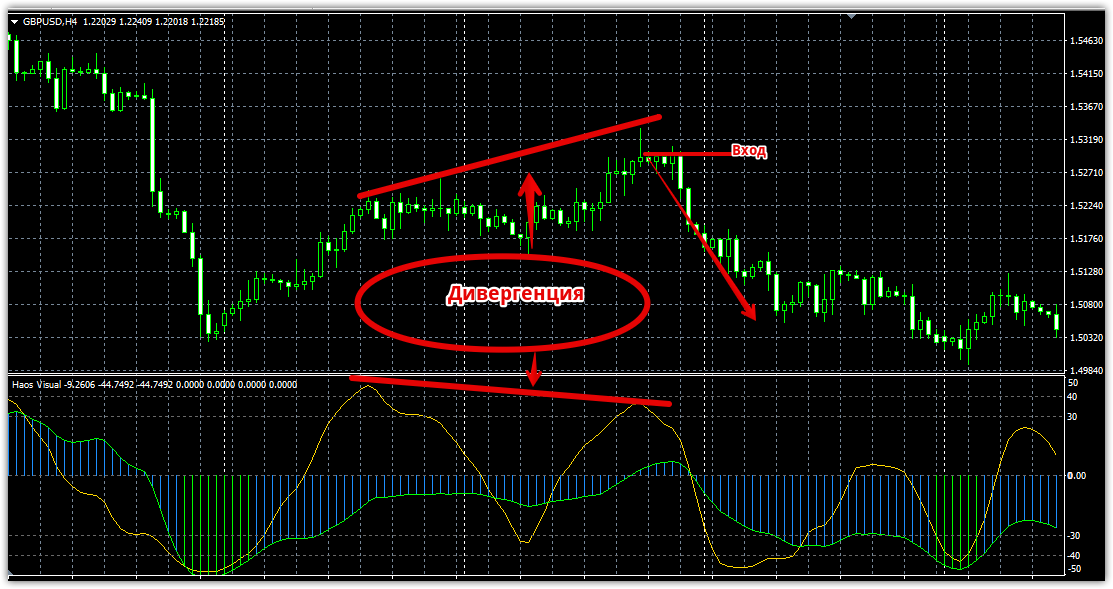
The second type of signals that the Chaos indicator gives is a reversal type, namely the divergence of the signal line. So, if the price highs on the chart do not coincide with the price highs of the signal line, we enter a sell position.
If the price lows do not coincide with the lows of the signal line, we enter a buy position.
It is also worth noting that the signal from divergence will strengthen if the direction of the signal coincides with the global trend displayed by the indicator histogram. An example of divergence is shown below:
In conclusion, it is worth noting that the histogram of the Chaos indicator is aimed at displaying a more global trend, so you can observe some lag in the indicator when the trend changes.
In general, the tool can be used alone, but to increase its profitability, it should be combined during the trading process with other technical or fundamental analysis tools.
Download the Chaos indicator.