Indicator - three screens
The appearance of the famous strategy “Elder's Three Screens” made a kind of revolution in the field of technical analysis.
If previously traders could only occasionally view what was happening on higher time frames, then thanks to the principles set out in the strategy, the number of signals opened against the trend has significantly decreased.
Actually, the fundamental principle of the strategy was to measure the trend and direction of the trend on higher time frames, and enter the market directly based on signals from the lower one and always towards the higher time frame.
The fact is that three screens for one currency pair take up the entire working space of the trading terminal, which makes it inconvenient to use the strategy.
The “Three Screens” indicator is a universal technical analysis tool that fully implements the Elder Three Screens strategy, but at the same time, all the information received is displayed for several currency pairs simultaneously in the form of a simple table.
“Three Screens” is a kind of hodgepodge of a number of standard technical indicators that can be used on any chart and customized depending on your own tasks.
Installing the Three Screens indicator
The tool was designed for use exclusively through the MT4 trading platform, so in order to use the tool, download it on the article page, and then carry out the installation procedure in the trading terminal.
The procedure for installing the “Three Screens” indicator occurs in a standard way, namely, you will need to place the indicator file in a specific folder in the data directory. In order to open the data catalog, launch your trading terminal and go to the “File” menu in the upper left corner.
By launching the “file” menu, a list of options will appear in front of you, among which we find “Data directory” and launch it. After launching the data directory, the terminal system folders will be displayed in front of you, among which find the folder called indicators and drop the “Three Screens” indicator into it.
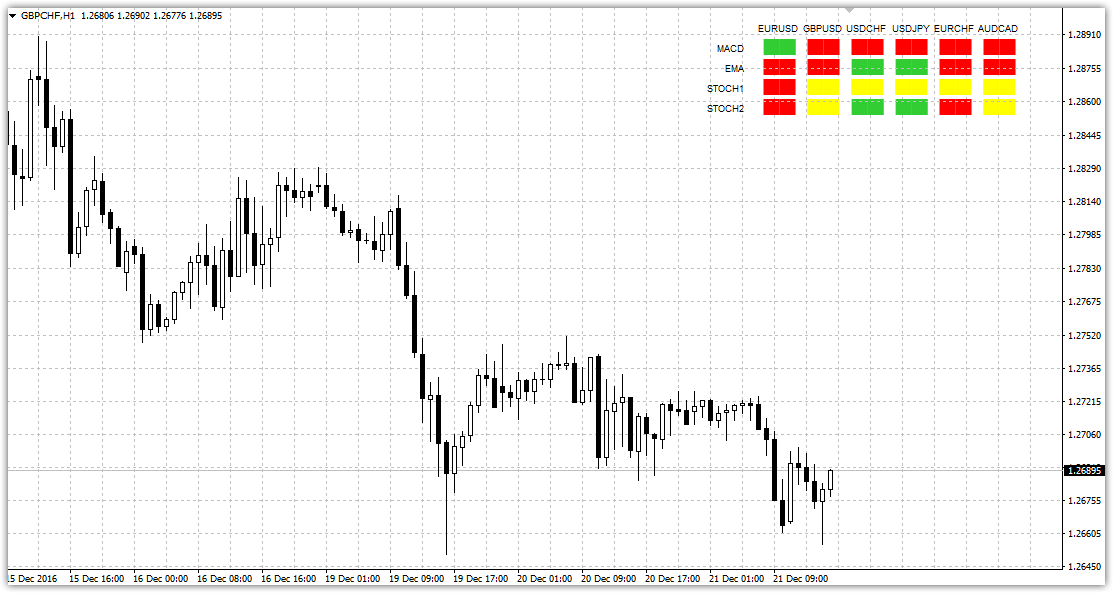
Next, close all directory folders and either update the platform in the “Navigator” panel, or simply restart MT4. For the indicator to appear on the chart, simply drag it onto the currency pair of your choice. If you did everything correctly, the graph will change like this:

Principle of signal generation
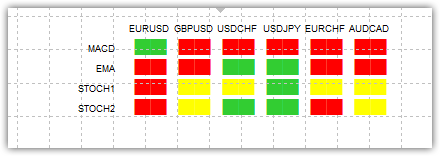
As you can see, the “Three Screens” indicator is implemented in the form of a simple table, where horizontally you can see a list of currency pairs, and vertically a list of indicators whose signals are painted over with squares of a certain color.
In order to correctly interpret the indicator readings, it is necessary to clearly understand how the signal of each indicator on the plate is generated.

1) MACD. The principle of signal formation occurs depending on the ratio of the current histogram column to the past. So, if the histogram column is higher than the previous one, the color of the cube is green, and if it is lower than the previous one, the color of the cube is red.
2) EMA. The principle of signal formation comes down to a banal assessment of the location of the price relative to the exponential moving average. So, if the price is above the moving average, the color of the cube will turn green, and if the price is below the moving average, the color of the cube will turn red.
3) Stochastic 1.2. The signal for this instrument is generated depending on the location of the line in the overbought and overbought zones on Forex.
So, if the stochastic line is in the range from 80 to 100, the color of the cube will change to red; if the line is in the range from 0 to 20, the color of the cube will turn red; if in the range between 20 and 80, the color of the cube will turn yellow. .
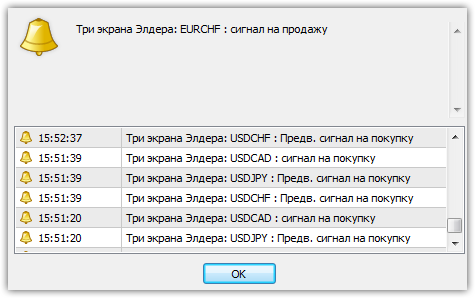
Based on the signal generation values, each trader himself chooses the moment of entry. However, you should understand that if a strong signal appears, the indicator will remind you more than once of its appearance using a sound signal and a pop-up sign.

Indicator settings
If we talk about settings, you can change both the periods of indicators in the lines and the time frames from which they display information on the chart.
In order to change the time frames of each of the components of the “Three Screens” indicator, indicate in the lines EMA Timeframe, MACD Timeframe, Stochastic Timeframe the value of the time frames you are interested in in minutes.
It is worth understanding that the indicator displays only information from standard time frames, so when indicating the value in minutes, be careful that it matches.
In conclusion, it is worth noting that the “Three Screens” indicator fully implements the famous trading tactics “Elder's Three Screens” in a simpler and more informative form, and unlike the original, you have the opportunity to track several currency pairs on Forex at the same time.
Download three Elder screens.
